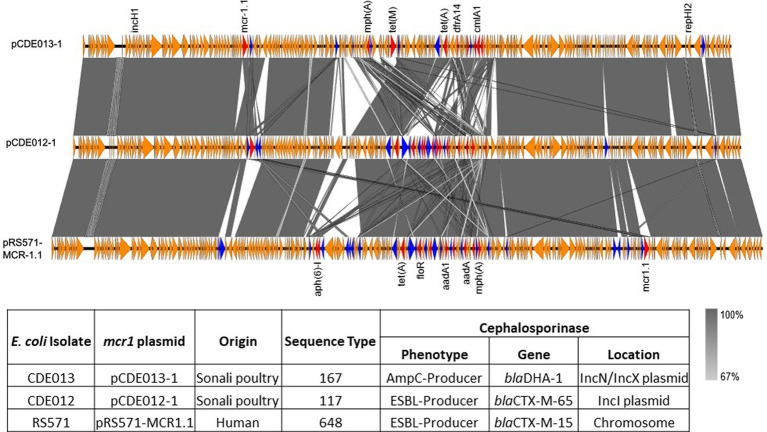
Figure 2.
Linear comparison of mcr1.1 plasmids pCDE013-1 (top), pCDE012-1 (middle) and pRS571-MCR-1.1 (lower). AMR genes are denoted in red, IS family transposons in blue, and other genes in orange. The grey area indicates the blast identities, and the percentage of identity is indicated in the legend. The arrow size is proportional to the gene length. The image was generated using EasyFig with default parameters.

