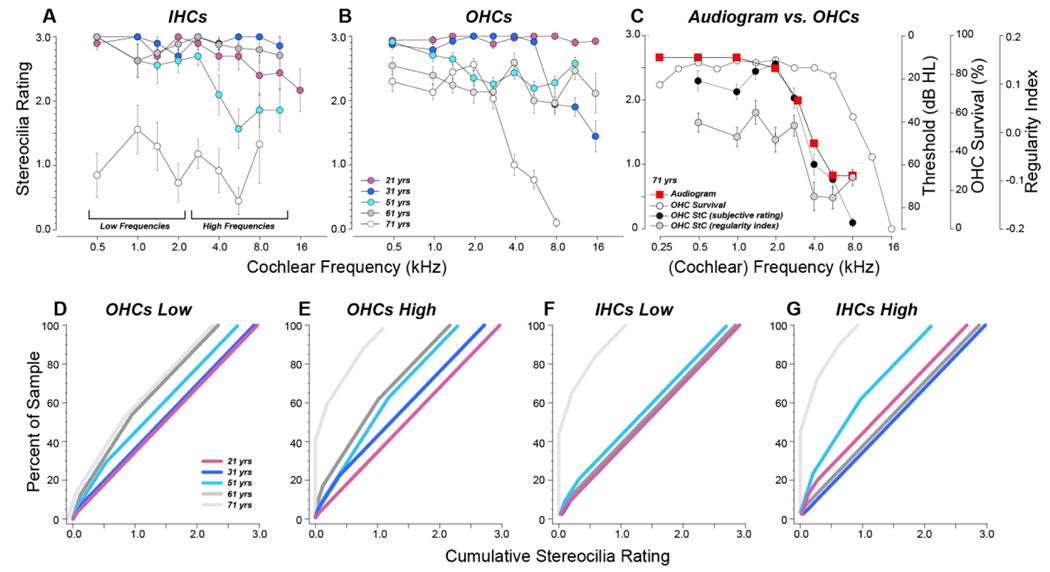
Figure 5:
Stereocilia ratings based on the semi-quantitative rating scale illustrated in Figure 4. A,B: Mean data (±SEMs) from each of the five cases. Symbol key in B also applies to A. C: Comparison of stereocilia subjective ratings, stereocilia regularity indexes, and hair cell survival to the audiogram in the oldest ear. OHC survival data are the same as those shown in Figure 1, stereocilia regularity indexes are the same as those in Fig. 8B, and stereocilia subjective ratings are the same as those in B. Only data from images with 2 or more surviving hair cells are shown. D-G: Cumulative distributions of stereocilia ratings for OHCs (D,E) and IHCs (F,G) pooled from the four low-frequency cochlear locations (D,F) or four high-frequency locations (E,G). Plots are generated by arranging the pooled ratings in ascending order and computing the running average while increasing the percentage of the sample included. Symbol key in D also applies to E,F and G.

