Figure 6:
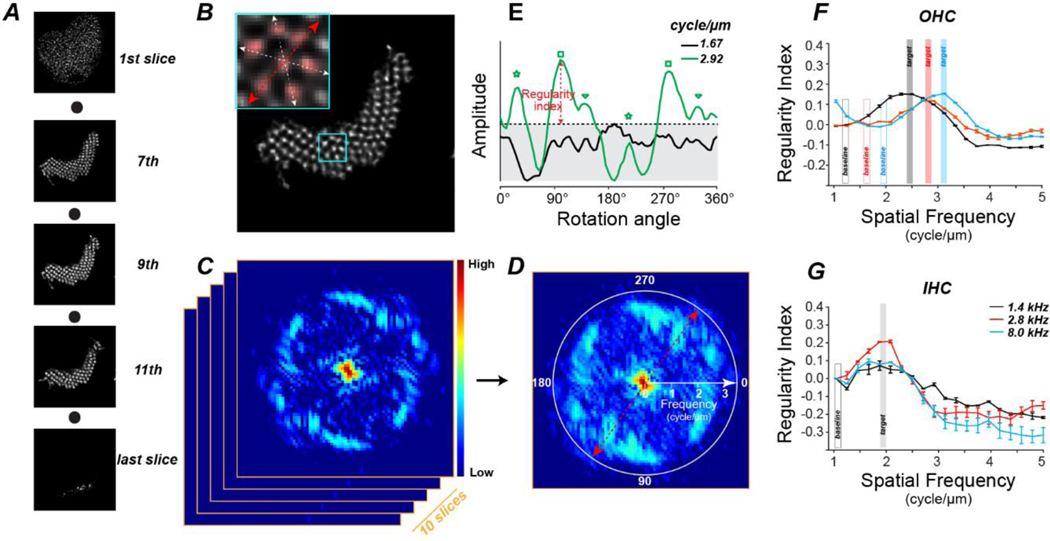
The algorithm for assessing stereocilia regularity using 2D FFT. A: A series of confocal slices from one hair bundle, from the cuticular plate (1st slice) to the stereocilia tips (last slice), of one OHC at 5.6 kHz region. B: Detail of the 9th z-slice through the hair bundle shown in A. Inset shows the area within the cyan rectangle, highlighting the hexagonal arrangement and the three cardinal axes of the stereocilia. C: The 2D FFT spectrum of the slice from B with amplitude coded as a heat map. 2D FFT is applied to 10 adjacent confocal slices from the middle of the z-stack. D: The maximum projection of the 2D spectra in C in polar coordinates, with spectral frequency along the radial axis as shown. Color bar in C also applies to D. E: The amplitude of the maximum-projection spectrum from D at two discrete spectral frequencies as a function of rotational angle, smoothed by a moving window average (5 adjacent data points). Regularity index is derived by subtracting the maximum amplitude at the spatial frequency of interest (2.92 cycles/μm in this example) from the maximum amplitude at the baseline frequency (1.67 cycle/μm in this example). Three pairs of green symbols indicate the three pairs of spectral peaks, respectively. F,G: Mean regularity indexes (±SEM) from the 21 yr old at 1.4, 2.8, and 8.0 kHz from OHCs (F) and IHCs (G).Target spatial frequencies for the older ears are defined from the peaks of these curves, as shown., Baseline frequencies are set at the trough below target, as shown.

