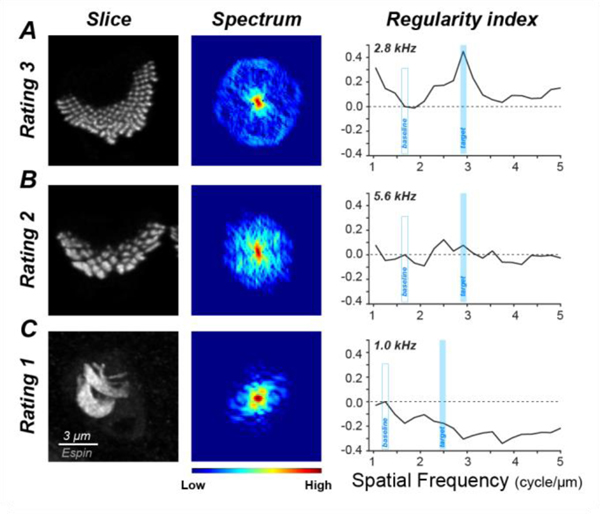
Figure 7:
Confocal projections, 2D spectra and regularity indexes for exemplars of OHC stereocilia bundles for each of the three non-zero values on the rating scale. For each example, the maximum projection of the hair bundle (1st column), the maximum projection of the 10 single-slice spectra (2nd column) and the regularity index as a function of spatial frequency computed from the projection spectrum are shown. The cochlear frequency region is indicated. Scale bar and color bar in C applies to all panels.

