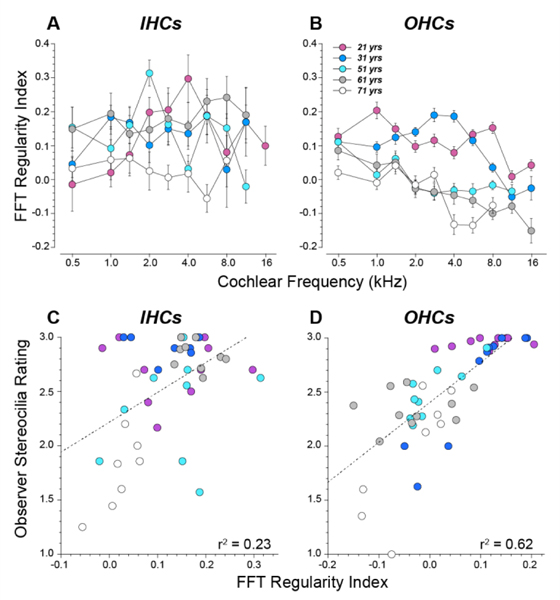
Figure 8:
Regularity indexes derived from the FFT analysis and their correlation with the semi-quantitative ratings from human observers. A,B: Mean values (SEMs) of the regularity index (see Figure 6) at each cochlear region in each of the five cases. C,D: Comparison of the mean FFT-based stereocilia ratings and the semi-quantitative human-observer ratings for each cochlear region in each case. Hair cells lacking stereocilia bundles were not included in these average values. Best-fit straight lines are shown, along with the r2 values. Data shown here include only cochlear regions with two or more surviving hair cells. Symbol key in B applies to all panels.

