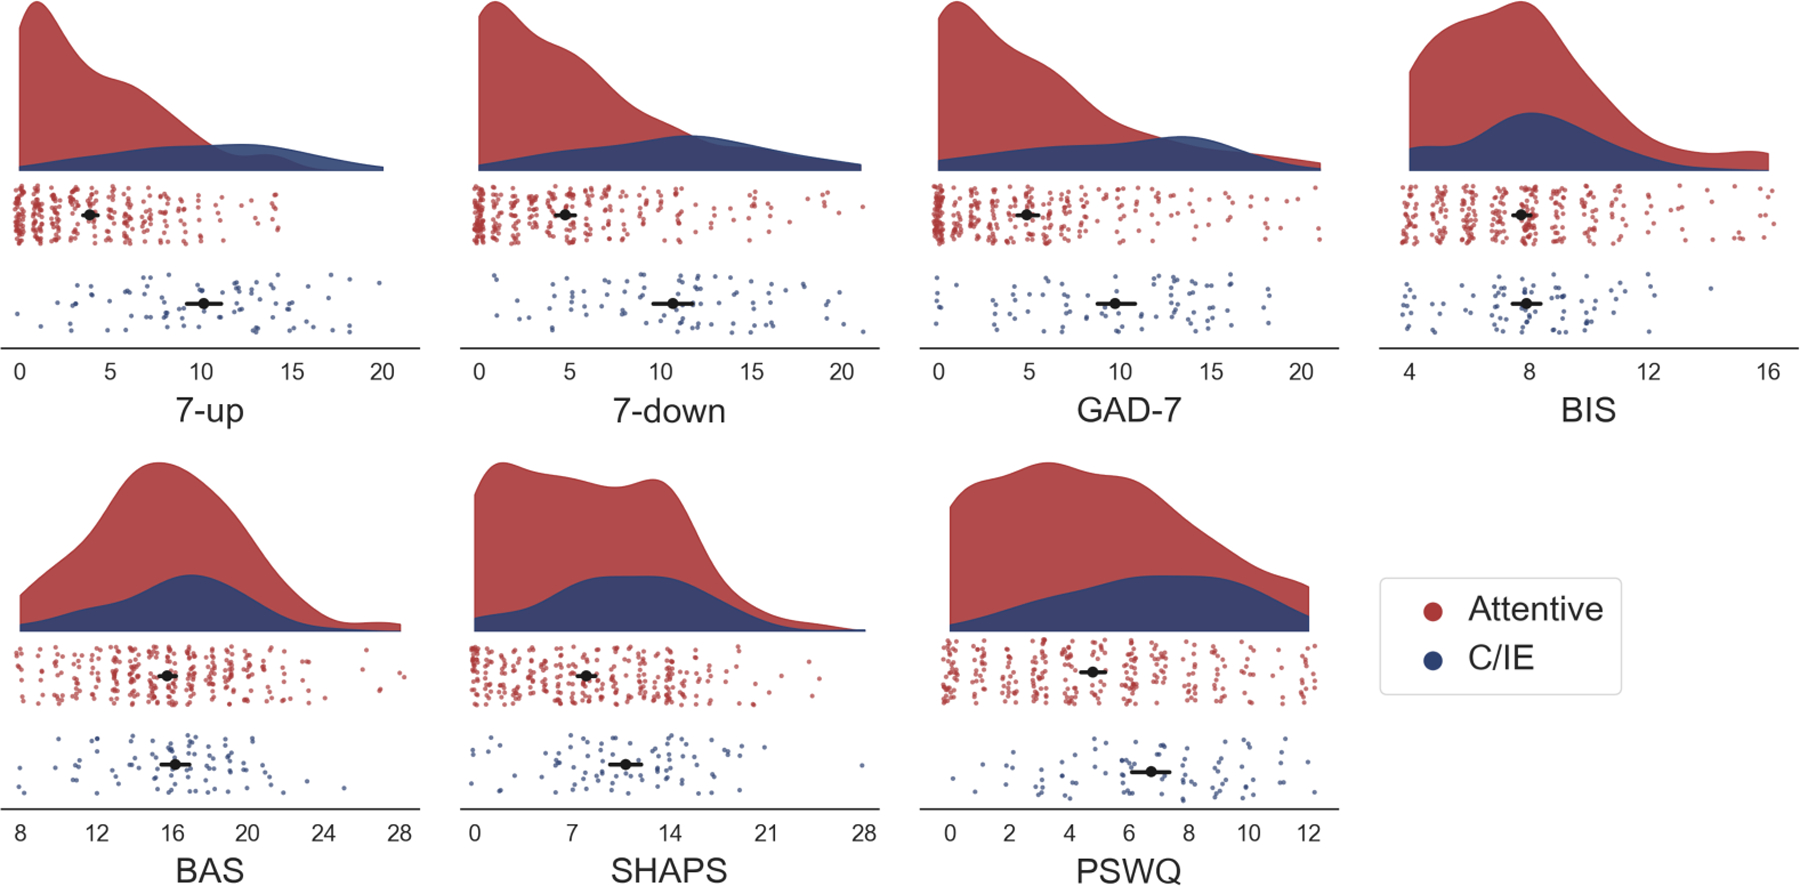
Figure 2:

Raincloud plots of total symptom scores in attentive (N = 301; red) and C/IE (N = 85; blue) participants. Each colored dot represents the symptom score for one participant. Black circles: average score within each group (error bars denote 95% bootstrap confidence interval). Shaded plots: distribution of scores for each group of participants. The scales are ordered approximately according to their estimated skew (see Table 2) from top-left (7-up) to bottom-right (PSWQ). The average level of symptom endorsement is most markedly different between groups in symptom measures with the lowest overall rates of endorsement.
