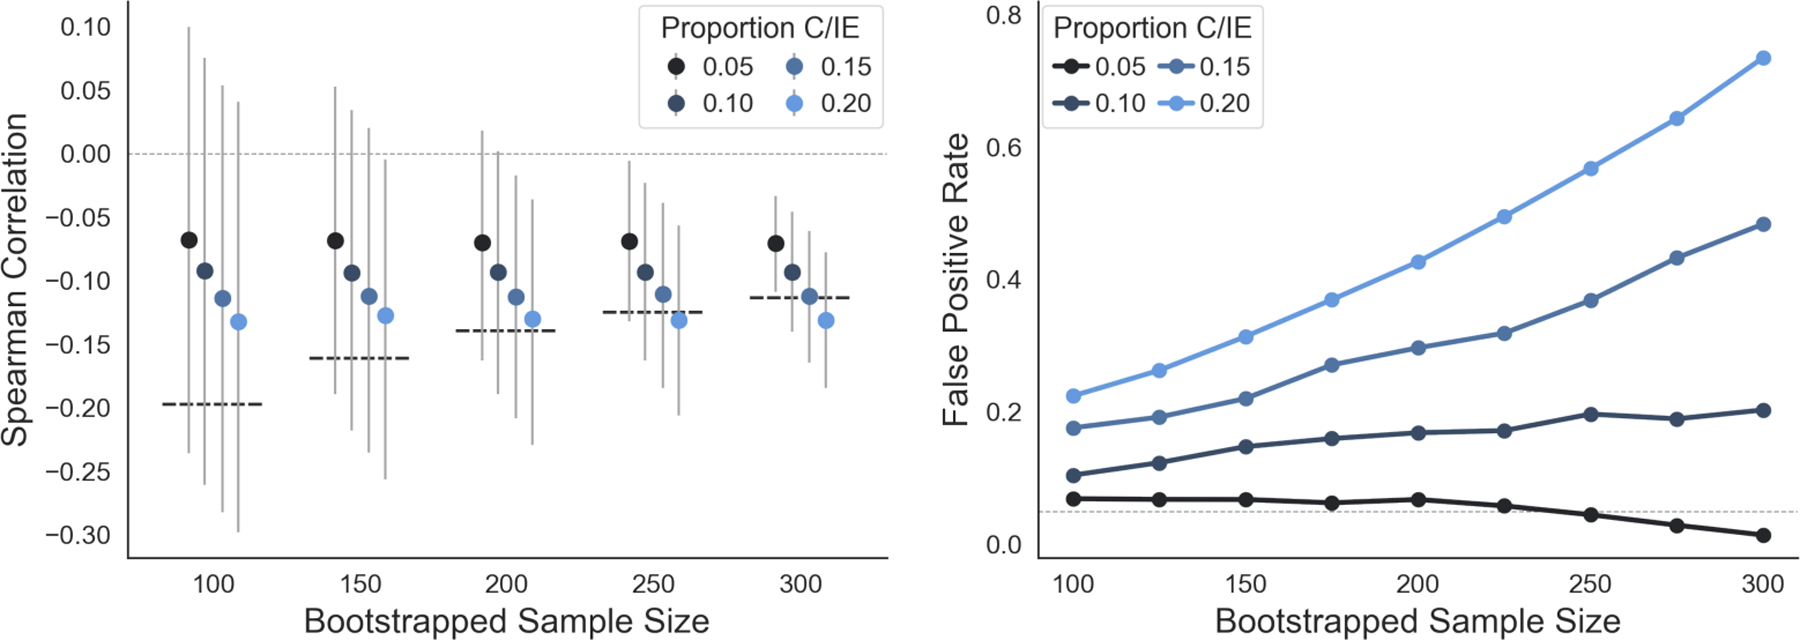
Figure 5:

False positive rates for spurious correlations increase with sample size. Left: Spearman rank correlations and 95% bootstrap confidence intervals between learning rate asymmetry (κ) and depression scores (7-down) as a function of sample size and proportion of C/IE participants. The thick dashed lines indicate the threshold for statistical significance for the Spearman correlation at the corresponding sample size. Markers are jittered along the x-axis for legibility. Right: False positive rates for learning rate asymmetry (κ) and depression scores (7-down) as a function of sample size and proportion of C/IE participants. False positive rate was calculated as the proportion of bootstrap samples in which the Spearman rank correlation between κ and 7-down was statistically significant (p < 0.05, two-sided). The horizontal dotted line denotes the expected false positive rate at α = 0.05.
