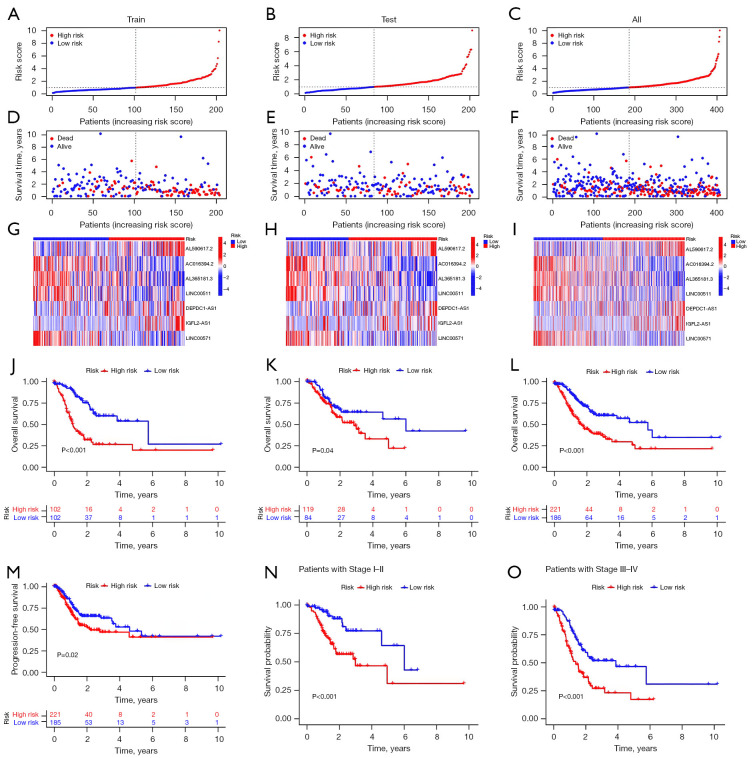
Figure 3.
Prognosis of the risk model across the various sets. (A-C) Train, test and complete set risk model demonstrations. (D-F) Relationship between the risk score and survival status for the train, test and complete set. (G-I) Heatmap of the train, test and complete lncRNA expressions. (J-L) The K-M survival graphs for the patients in the high- and low-risk groups in the train, test and complete sets. (M) PFS in the complete set. (N,O) Complete set of the K-M survival curves for the different tumour stages. LncRNA, long non-coding RNA; K-M, Kaplan-Meier; PFS, progression-free survival.

