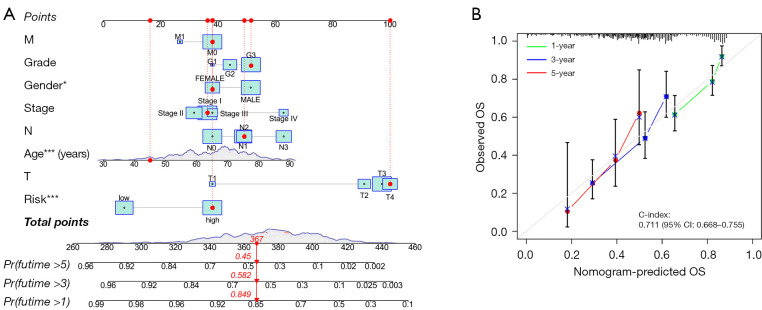
Figure 5.
Nomogram and model calibration curves. (A) OS prediction nomogram. (B) OS calibration curves at 1, 3 and 5 years. *, *** represent P<0.05, and P<0.001, respectively. Pr, probability; T, tumor; N, node; M, metastasis; OS, overall survival; CI, confidence interval; C-index, concordance index.

