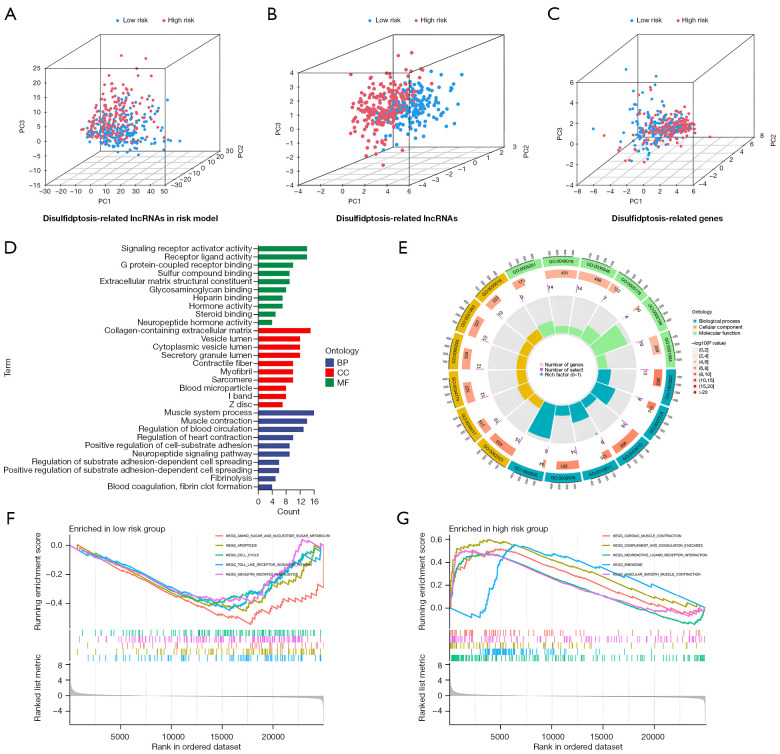
Figure 6.
PCA and functional analysis. (A-C) PCA analysis detected sample distribution by the risk of disulfidptosis-related lncRNAs, disulfidptosis-related lncRNAs and disulfidptosis-related genes. (D,E) GO analysis in the low- and high-risk patient groups. (F,G) GSEA analysis in the low- and high-risk patient groups. PC1, 2, 3 represent the first to the third principal components of the matrix. BP, biological process; CC, cellular compartment; MF, molecular function; GO, Gene Ontology; KEGG, Kyoto Encyclopedia of Genes and Genomes; PCA, principal component analysis; lncRNA, long non-coding RNA; GSEA, Gene Set Enrichment Analysis.

