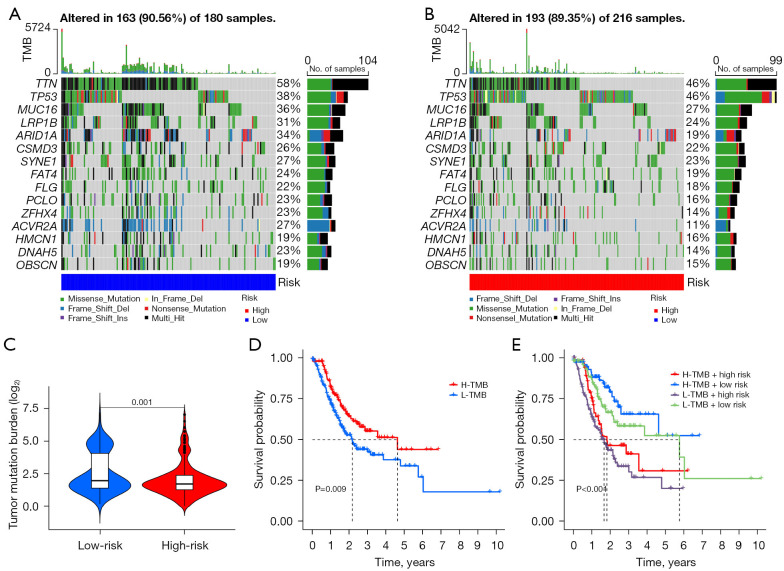
Figure 8.
Association of gene mutations and TMB analysis. (A,B) Mutations in somatic cells found in the various risk groups. (C) TMB level in the different groups. (D) Different degrees of TMB survival curves. (E) K-M survival profiles with varying TMB concentrations in the different risk categories. TMB, tumor mutation burden; H, high; L, low; K-M, Kaplan-Meier.

