
Fig. 1. SLC25A39 is a short–half life protein regulated by mitochondrial GSH availability.
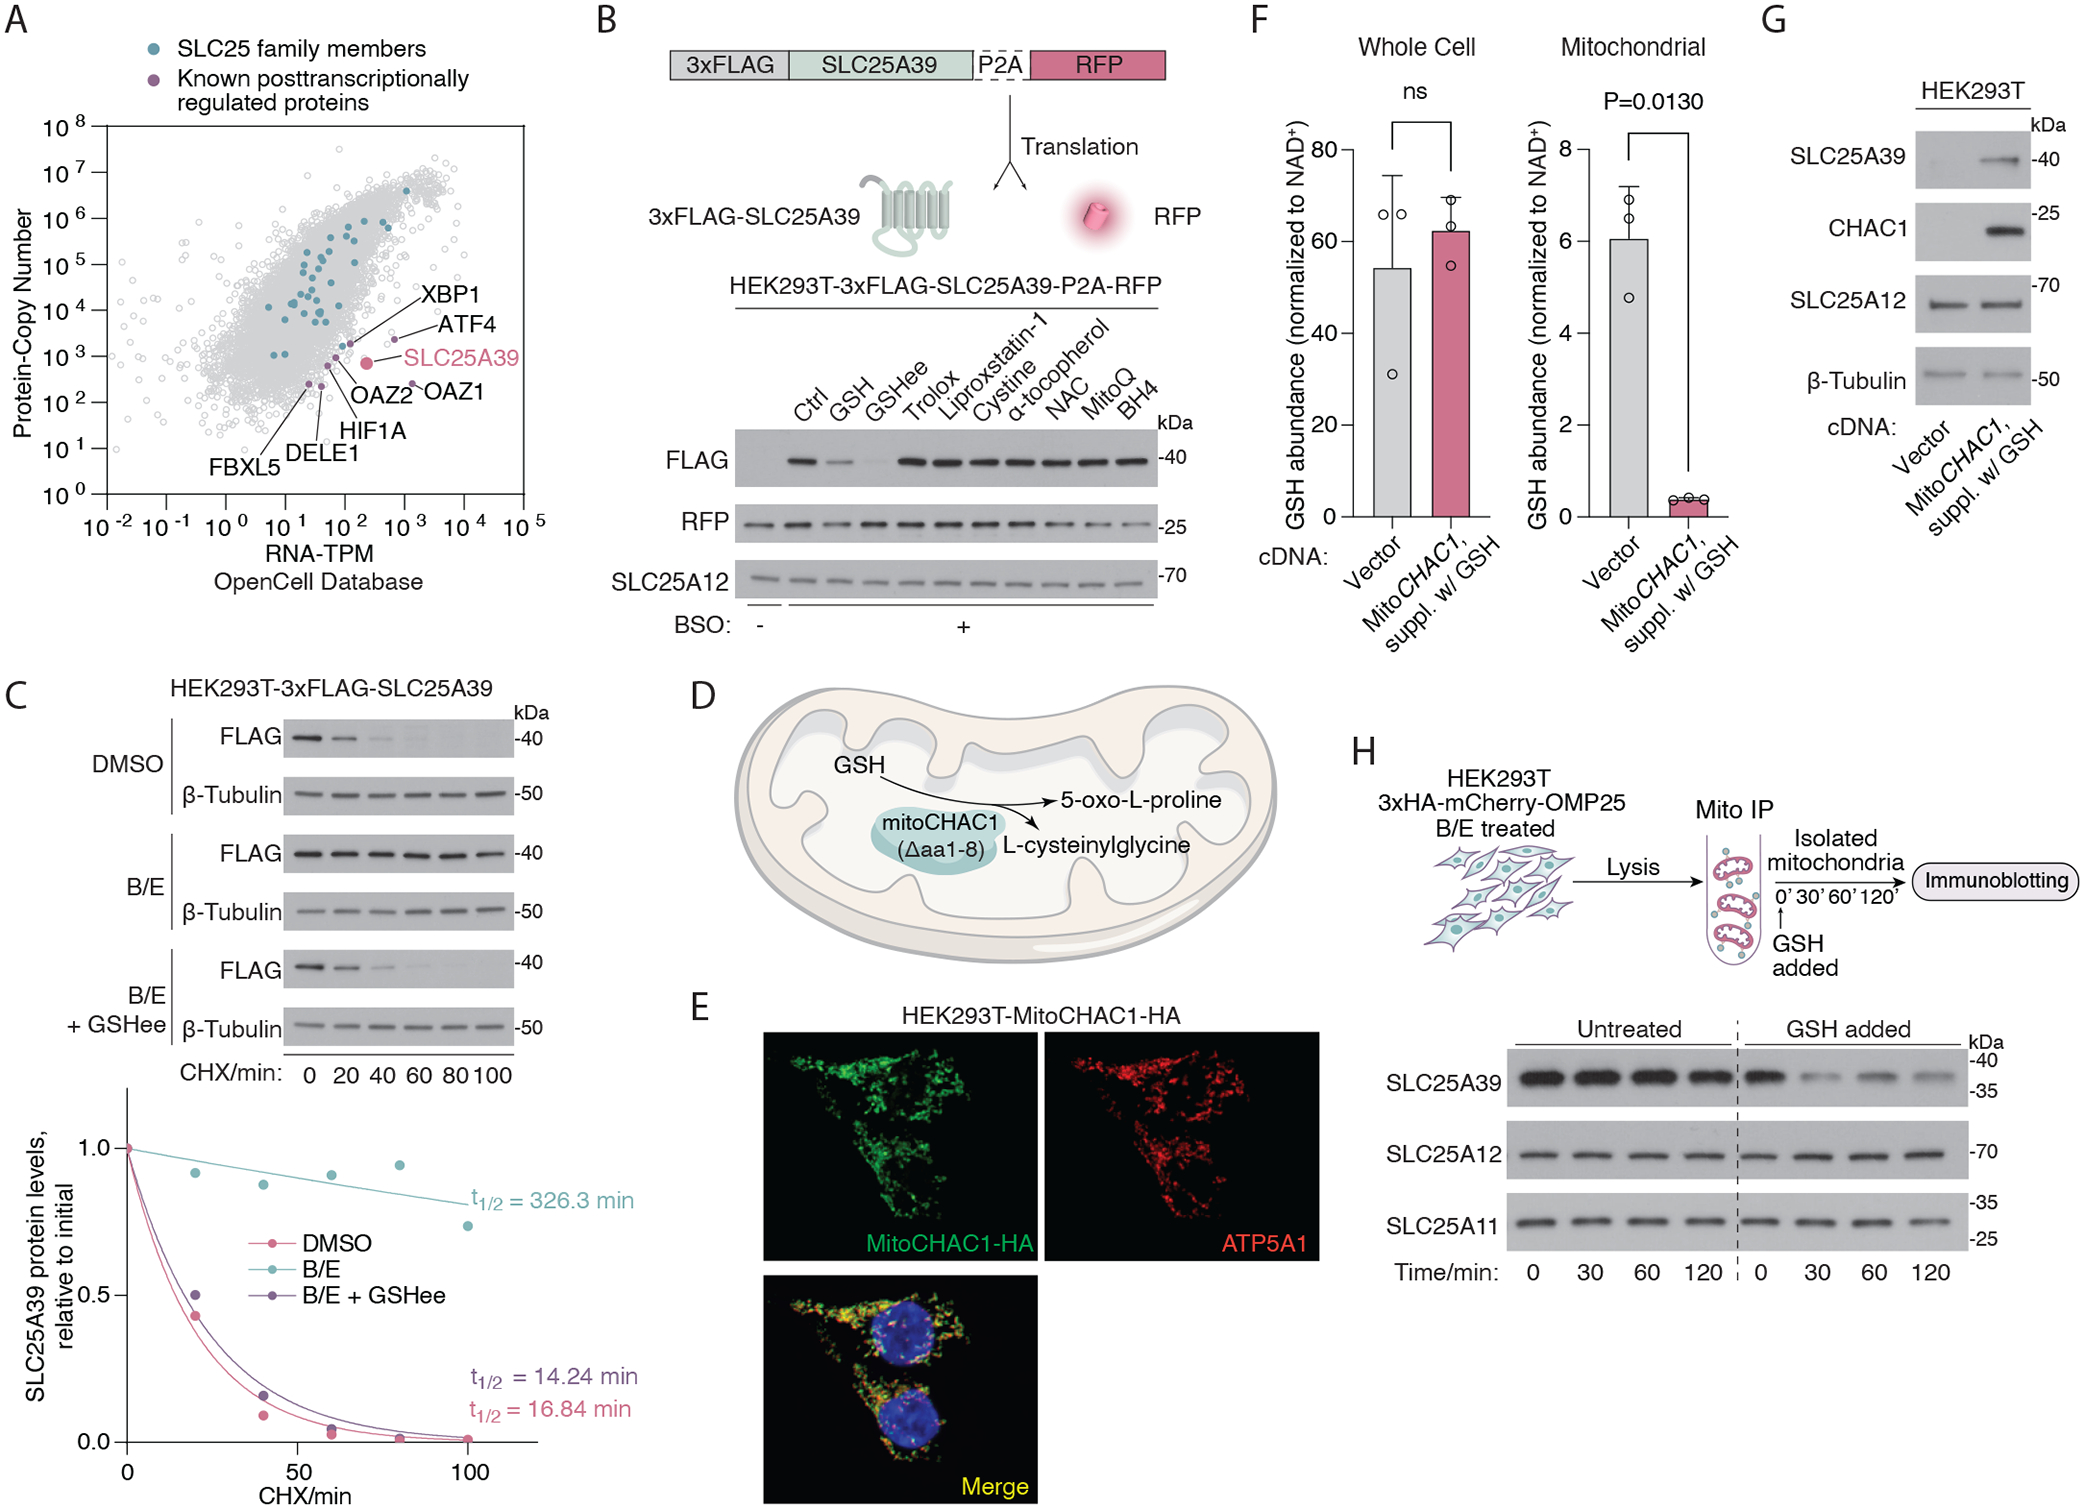
(A) Scatter plot showing the protein copy number versus mRNA abundance (TPM) for all genes in HEK293T cells detectable across the proteome. Original data were retrieved from the OpenCell database. Green dots denote SLC25 family proteins, and purple dots denote representative proteins known to be regulated post transcriptionally. (B) (Top) Schematic showing the construct for cotranslational expression of 3xFLAG-tagged SLC25A39 and RFP, separated by a self-cleaving P2A peptide. (Bottom) Immunoblots of the indicated proteins in HEK293T cells expressing the aforementioned construct. Cells were treated with BSO (1 mM) for 48 hours and were then treated with GSH (10 mM), GSH ethyl ester (GSHee, 10 mM), Trolox (50 μM), Liproxstatin-1 (1 μM), cystine (200 μM), N-acetylcysteine (NAC, 1 mM), α-tocopherol (5 μM), MitoQ (30 nM), or BH4 (4 μM) for 8 hours. RFP was used as an internal control for the translational levels of the construct, and SLC25A12 was used as a loading control. (C) (Top) Immunoblots of the indicated proteins in HEK293T cells expressing 3xFLAG-SLC25A39 cDNA treated with cycloheximide (CHX, 50 μg/ml) for the indicated times. Prior to CHX treatment, cells were treated with BSO (1 mM) and erastin (5 μM) for 24 hours and GSH ethyl ester (GSHee, 10 mM) for 8 hours. DMSO was used as the control. β-tubulin was used as a loading control. (Bottom) Quantification of FLAG band signal intensity from the immunoblots above. Half-life (t1/2) was calculated by the nonlinear fitting of FLAG band signal intensity versus time to one phase decay exponential model. (D) Schematic showing the localization and the catalytic reaction of engineered MitoCHAC1 protein. (E) Immunofluorescence images of MitoCHAC1 (HA, green), ATP5A1 (red), and DAPI (blue) in HEK293T cells. (F) Whole-cell and mitochondrial abundance of GSH (normalized to NAD+ abundance) in HEK293T cells expressing empty vector or MitoCHAC1 (in the presence of exogenous GSH). Data are mean ± SD representing three biologically independent samples. P values were calculated from Welch’s t test. (G) Immunoblots showing the amounts of the indicated proteins in HEK293T cells that express an empty vector or MitoCHAC1 (in the presence of exogenous GSH). SLC25A12 and β-tubulin were used as loading controls. (H) (Top) The schematic of the cell-free assay that uses immunopurified mitochondria (mito IP) from HEK293T cells to analyze SLC25A39 stability. (Bottom) Immunoblots of the indicated proteins from purified mitochondria after treating them with GSH (20 mM) for the indicated times. SLC25A12 and SLC25A11 were used as loading controls.