
Fig. 2. AFG3L2 binds and degrades SLC25A39 through a matrix loop domain in a GSH-dependent manner.
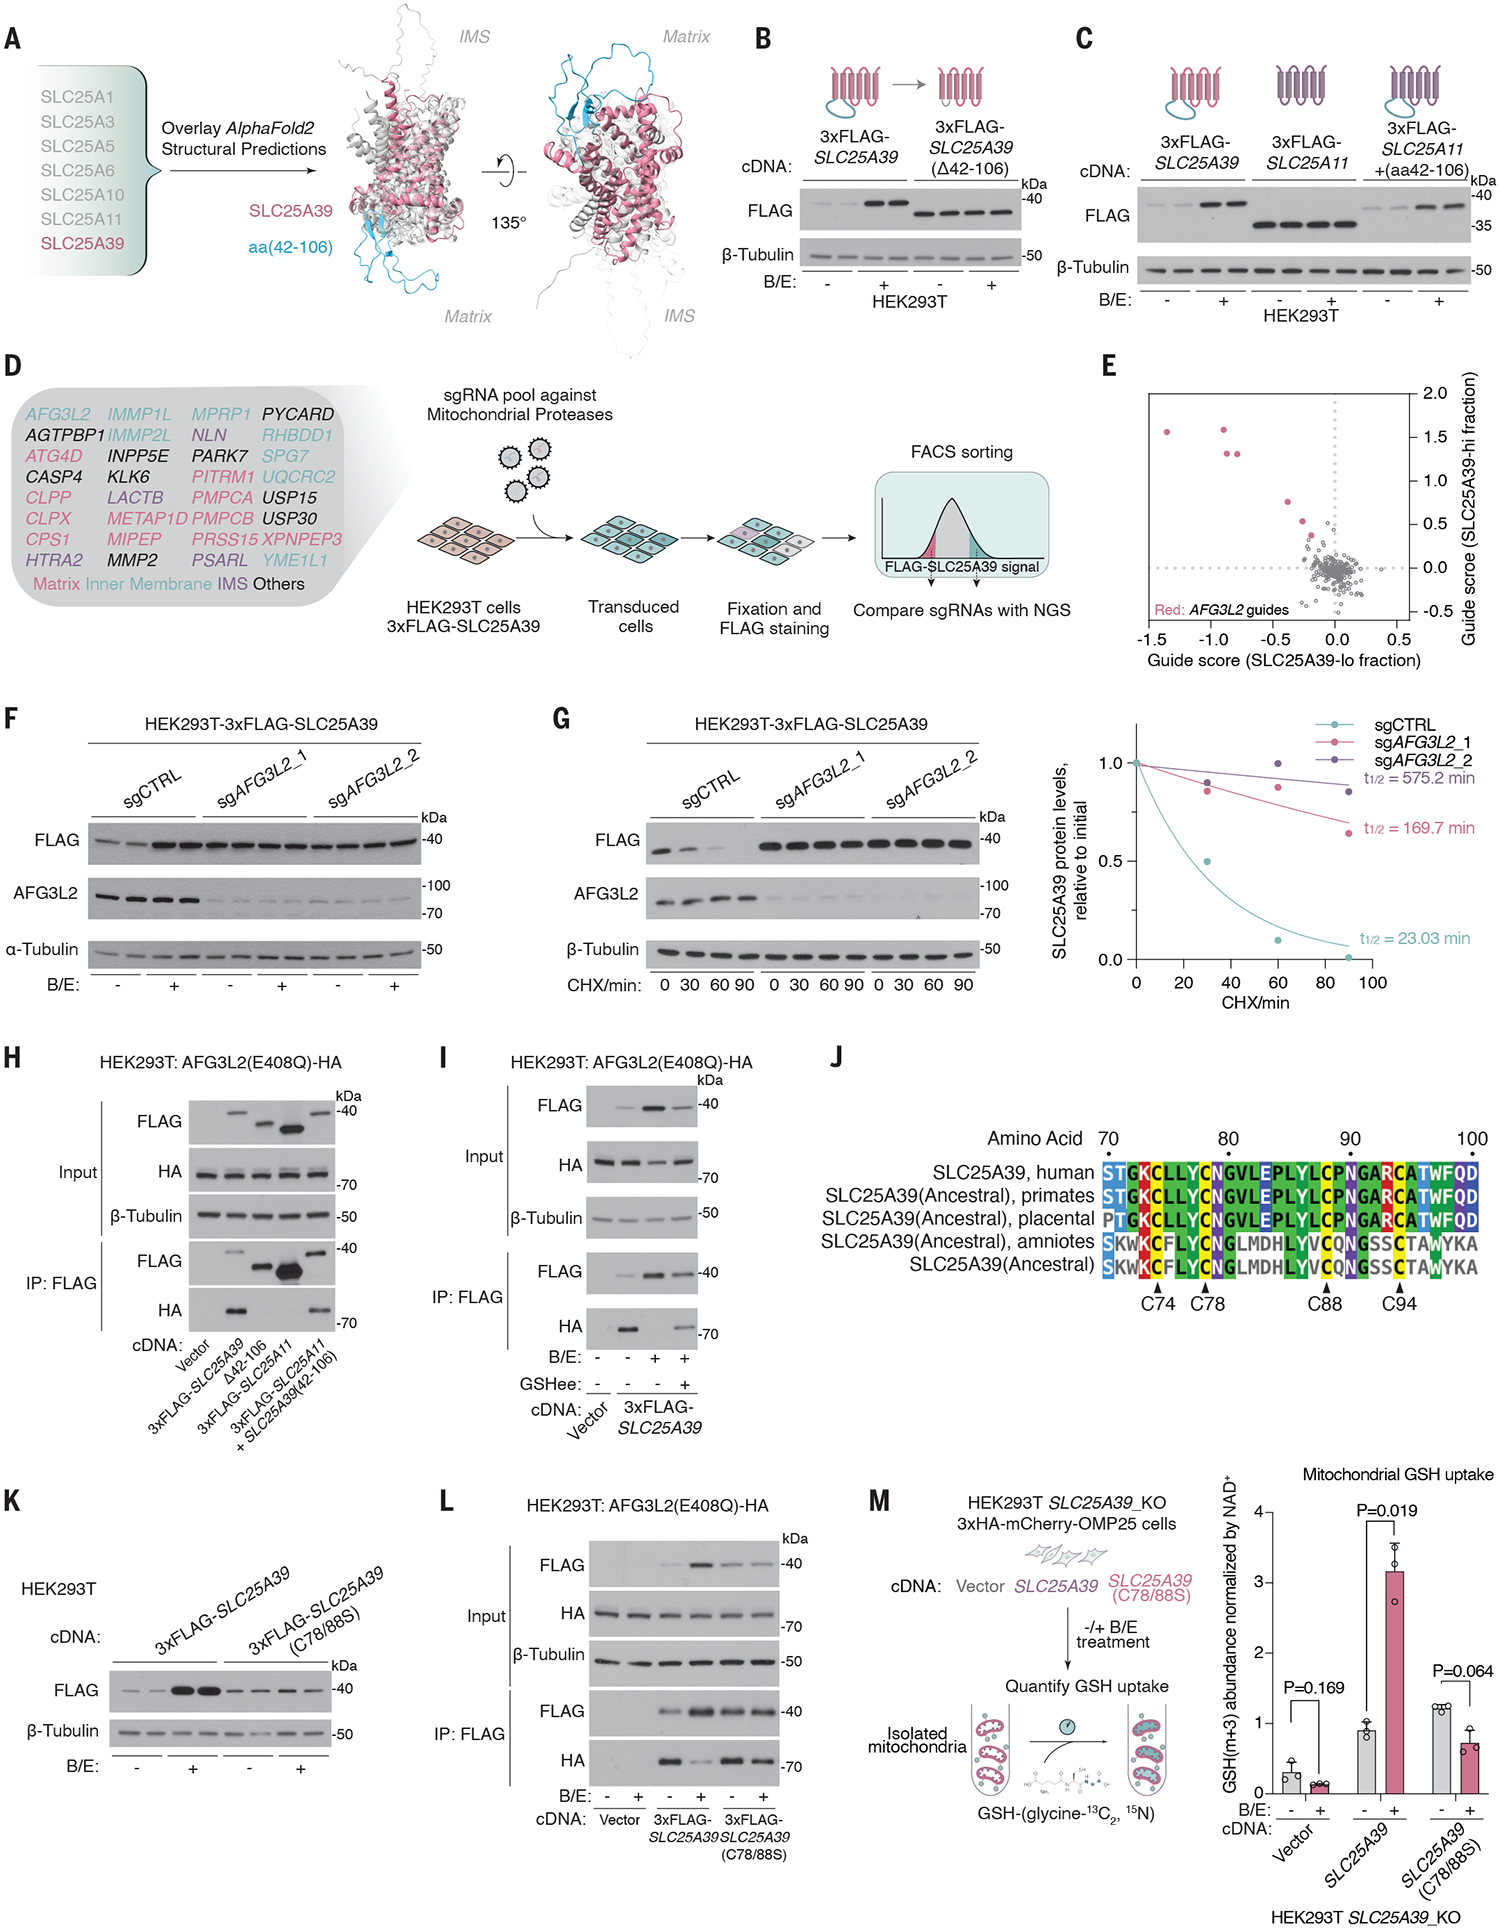
(A) Schematic showing the alignment of AlphaFold2-predicted structural models of the indicated proteins. SLC25A39 is highlighted in pink, with aa42–106 highlighted in green. (B) Immunoblots of the indicated proteins in HEK293T cells expressing 3xFLAG-SLC25A39 or 3xFLAG-SLC25A39 without the matrix-facing loop (Δaa42–106) after 24-hour treatment with BSO (1 mM) and erastin (5 μM) or DMSO as the control. (C) Immunoblots of the indicated proteins in HEK293T cells expressing 3xFLAG-SLC25A39, 3xFLAG-SLC25A11, or a chimeric protein in which aa42–106 of SLC25A39 is spliced into SLC25A11 after 24-hour treatment with BSO (1 mM) and erastin (5 μM) or DMSO as the control. (D) Schematic showing the library design of the mitochondrial peptidase sgRNA library and the workflow of the FACS-based CRISPR screen for 3xFLAG-SLC25A39 stability. (E) Scatter plot showing the enrichment of sgRNAs targeting mitochondrial proteases in the SLC25A39-lo cell fraction (x axis) and SLC25A39-hi cell fraction (y axis). Red dots represent sgRNAs targeting AFG3L2. (F) Immunoblots of the indicated proteins in HEK293T cells expressing 3xFLAG-SLC25A39 and sgRNAs targeting control or AFG3L2 after 24-hour treatment with BSO (1 mM) and erastin (5 μM) or DMSO as the control. (G) (Left) Immunoblots of the indicated proteins in HEK293T cells expressing 3xFLAG-SLC25A39 and sgRNAs targeting AFG3L2 or control upon treatment with cycloheximide (CHX, 50 μg/ml) for the indicated times. β-tubulin was used as a loading control. (Right) Quantification of FLAG bands signal intensity from the immunoblots. Half-life (t1/2) was calculated by the nonlinear fitting of FLAG band signal intensity versus time to one phase decay exponential model. (H) Immunoblots of the indicated proteins from whole-cell lysates or FLAG-immunoprecipitation from HEK293T cells stably expressing cDNAs for vector, 3xFLAG-SLC25A39, 3xFLAG-SLC25A39 lacking matrix-facing loop (Δaa42–106), 3xFLAG-SLC25A11, or a chimeric protein in which aa42–106 of SLC25A39 is spliced into SLC25A11 and transiently transfected with AFG3L2 (E408Q)-HA cDNA. (I) Immunoblots of the indicated proteins from whole-cell lysates or FLAG immunoprecipitation from HEK293T cells stably expressing cDNA for empty vector or 3xFLAG-SLC25A39 and are transiently transfected with AFG3L2(E408Q)-HA cDNA. Cells were treated for 24 hours with BSO (1 mM) and erastin (5 μM) or DMSO as the control. Indicated cells were then treated for 8 hours with GSHee (10 mM). (J) Multiple sequence alignment between SLC25A39 and the inferred ancestral sequence of SLC25A39 reconstructed from amino acid sequences of SLC25A39 homologs in the indicated taxa. Four conserved cysteines in the matrix-facing loop are highlighted. (K) Immunoblots for the indicated proteins in HEK293T cells that express 3xFLAG-SLC25A39 or 3xFLAG-SLC25A39(C78/88S). Cells were treated for 24 hours with BSO (1 mM) and erastin (5 μM) or DMSO as the control. (L) Immunoblot of the indicated proteins from whole-cell lysates or FLAG immunoprecipitation from HEK293T cells stably expressing cDNAs for vector, 3xFLAG-SLC25A39, or 3xFLAG-SLC25A39(C78/88S) and are transiently transfected with AFG3L2(E408Q)-HA cDNA. Cells were treated for 24 hours with BSO (1 mM) and erastin (5 μM) or DMSO as the control. (M) (Left) Schematic showing the GSH uptake assay that uses immunopurified mitochondria from HEK293T-SLC25A39_KO cells expressing cDNAs for empty vector, SLC25A39, or SLC25A39(C78/88S). (Right) Abundance of GSH-(glycine-13C2 ,15N) taken up by isolated mitochondria. Data are mean ± SD representing three biologically independent samples. P values were calculated from Welch’s multiple t test with the Holm-Šídák method.