
Figure 4.
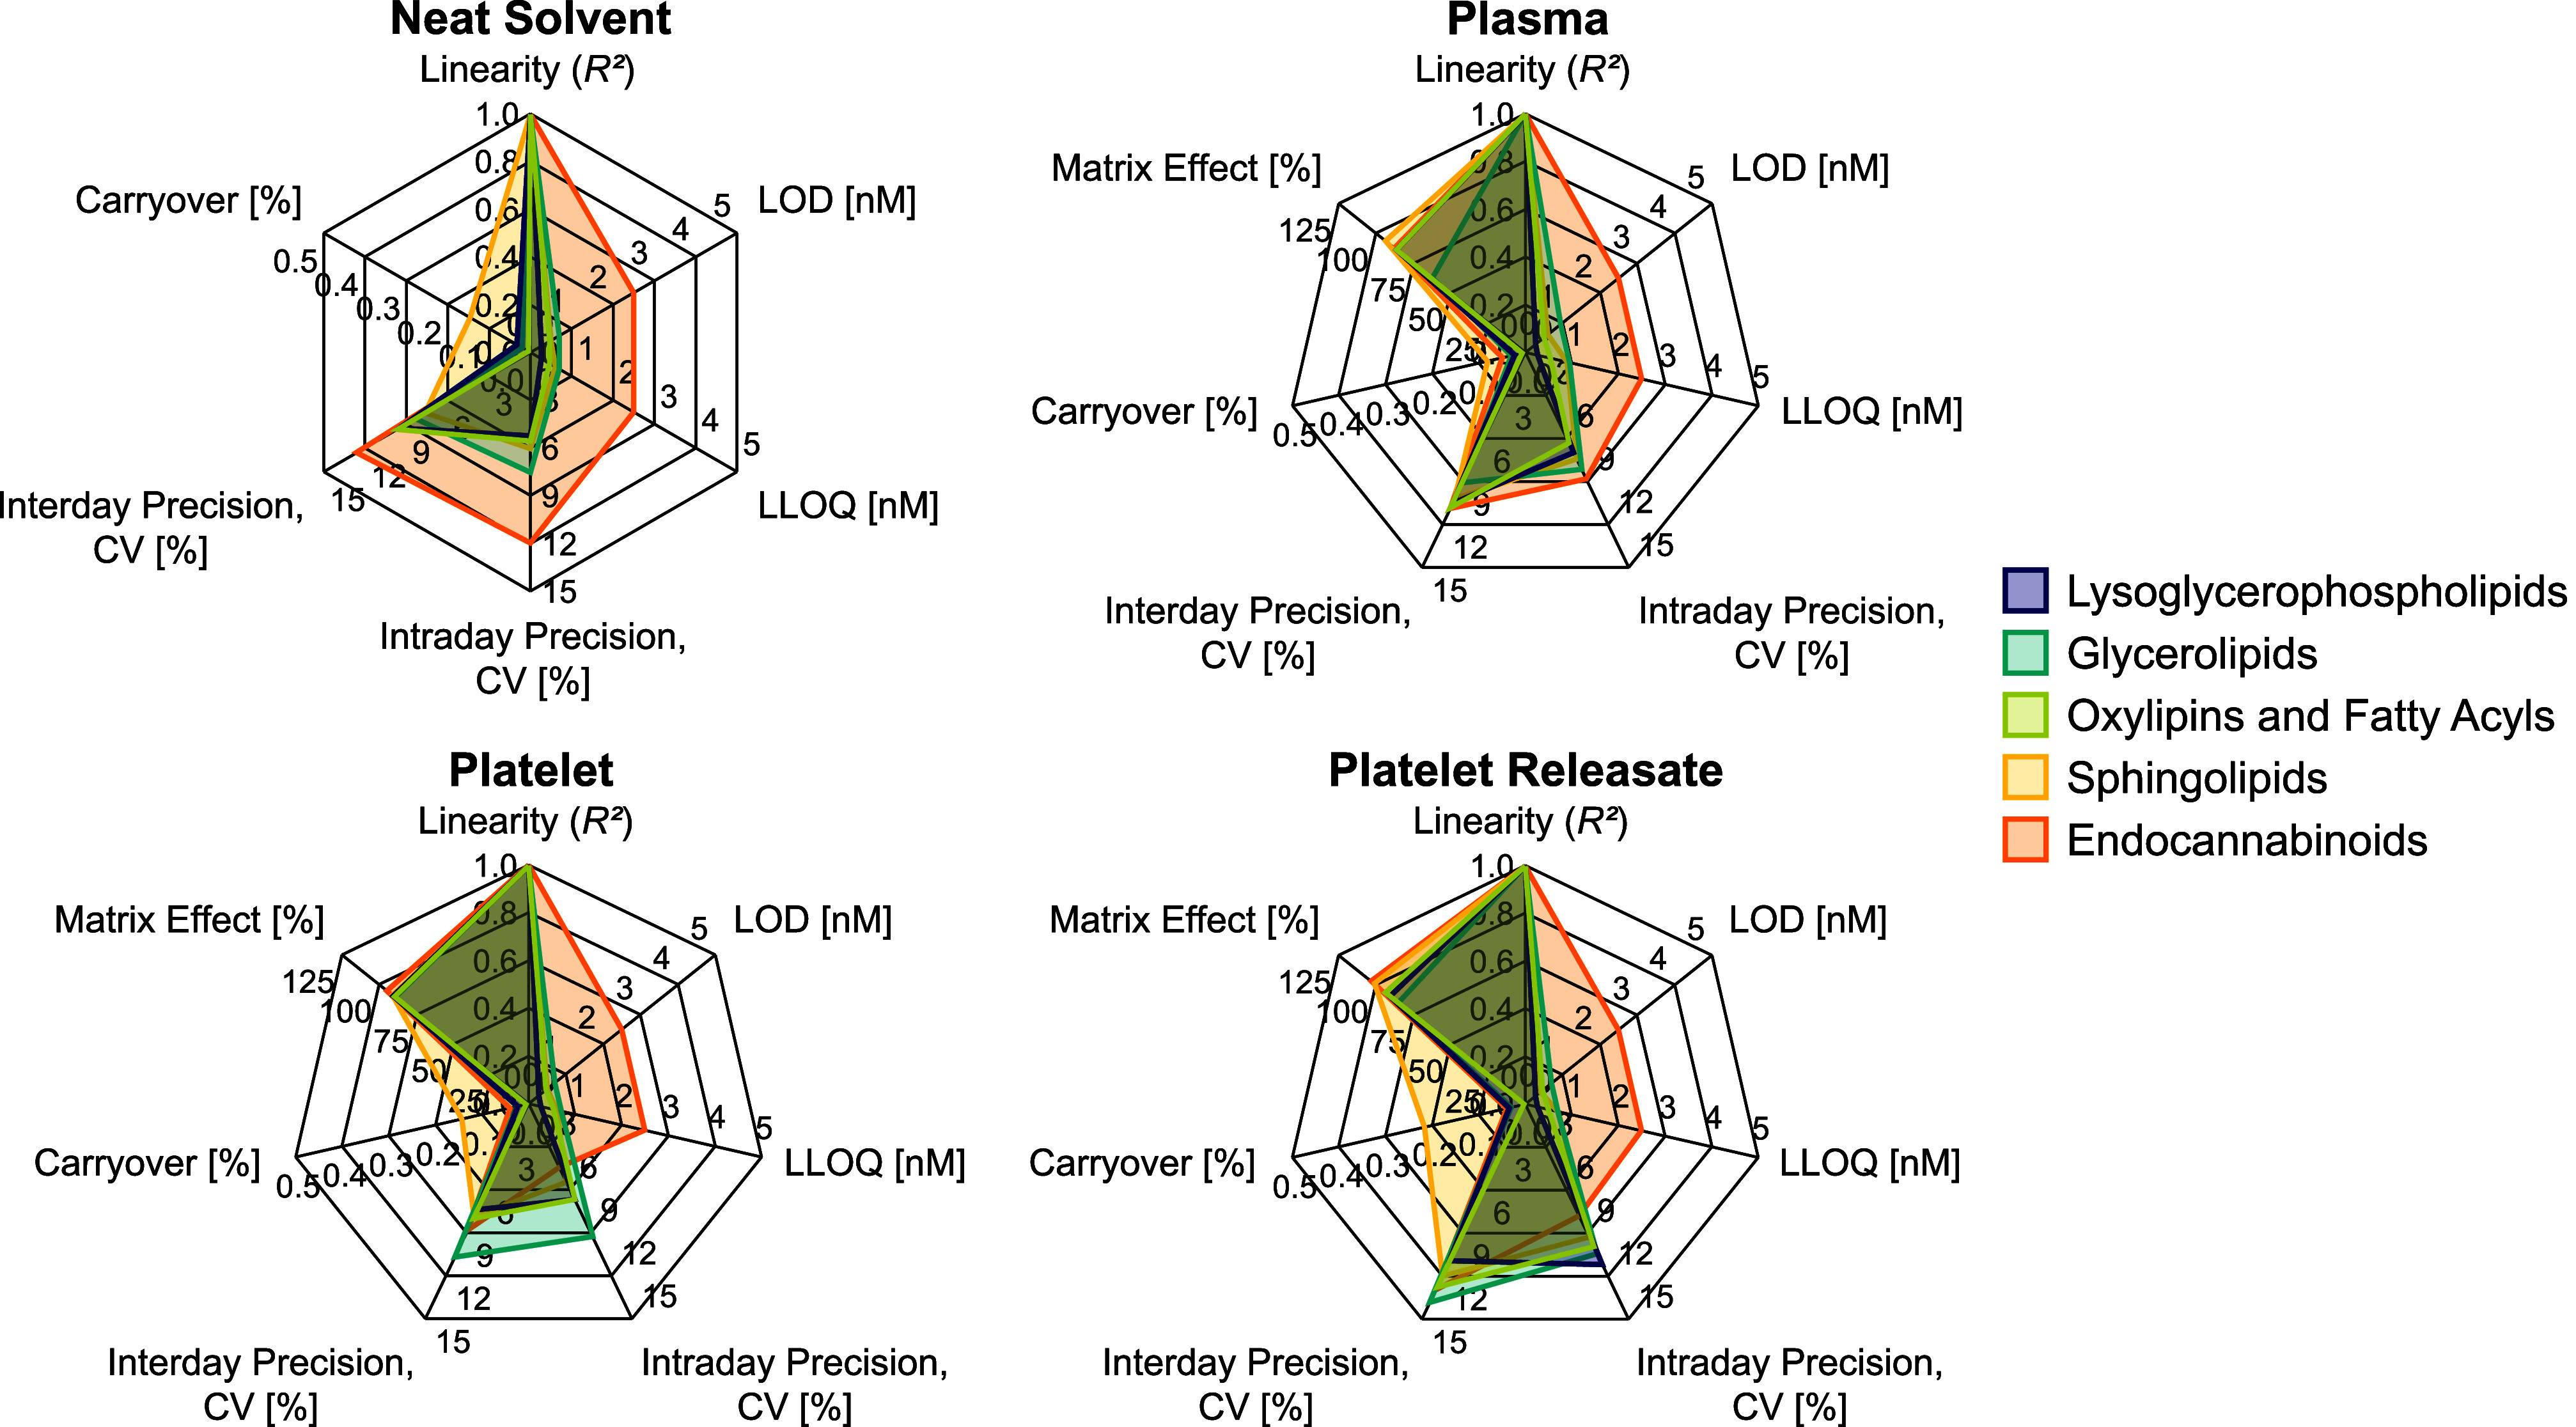
Method characteristics evaluated in neat solvent, plasma, platelet, and platelet releasate (n = 3). Values are given as an average for each lipid category. Detailed results can be found in Tables S10–S12. CV = coefficient of variation, LOD = limit of detection, LLOQ = lower limit of quantification.