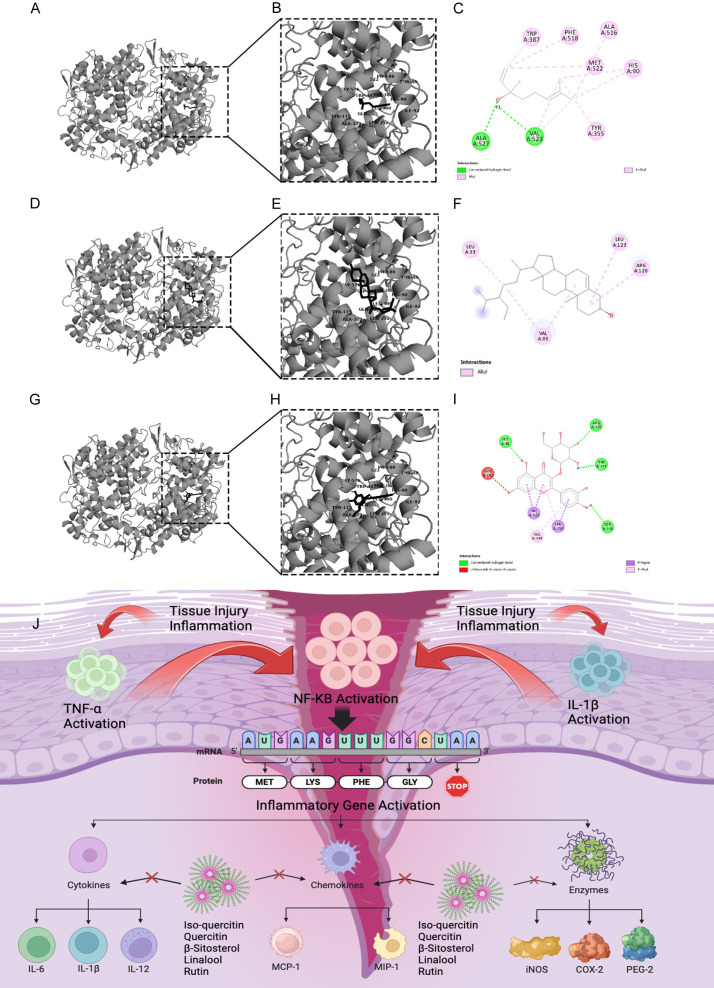
Figure 10.
Schematic representation of interaction between COX-2 receptor and three distinct ligands (Linalool in the first row, quercetin in the second row and beta-sitosterol in the third row). Each column depicts a specific ligand-protein complex. (A, D and G) represent the 3D structures showing the overall docked configuration, while (B, E and H) offer magnified views of the ligand binding pockets within the protein structure. Complementary to the 3D structures, (C, F and I) provide 2D diagrams illustrating the key molecular interactions between the ligands and the protein residues. (J) The figure represents molecular mechanism of anti-inflammatory and antinociceptive effect of J. sambac gel in musculoskeletal injury.

