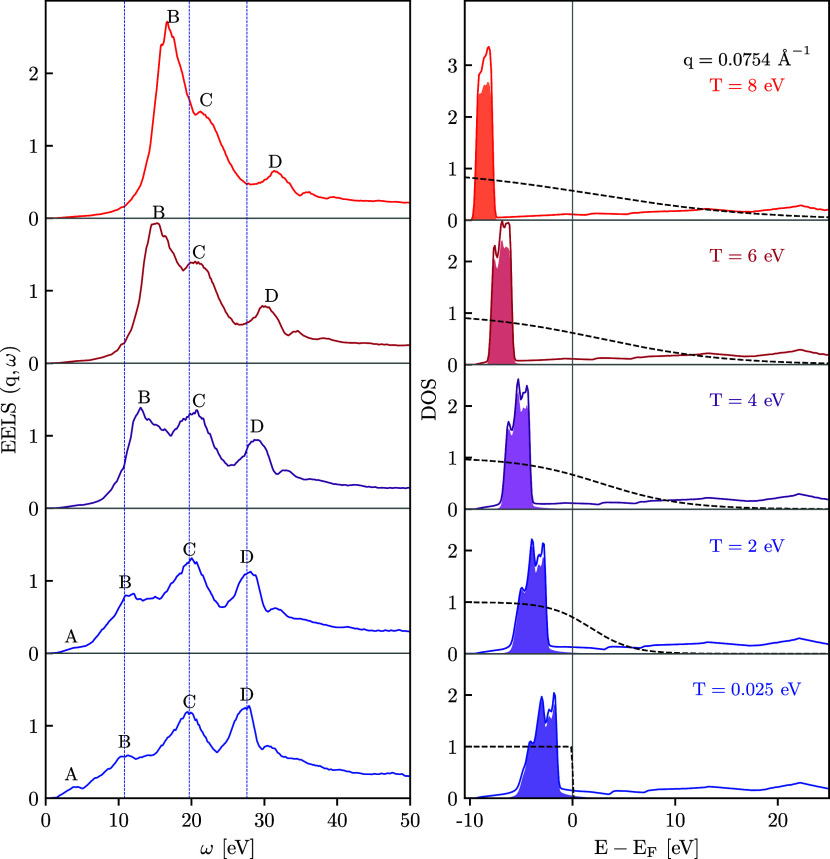
Figure 1.
Left panel: EELS spectrum along the [100] direction. Right panel: total DOS (solid lines), projected DOS on d-orbital (shaded), and Fermi–Dirac occupation number distribution (dashed lines). Shown are results for q = 0.0754 Å–1 at ambient conditions [T = 0.025 eV], at T = 2, T = 4, T = 6, and at T = 8 eV.

