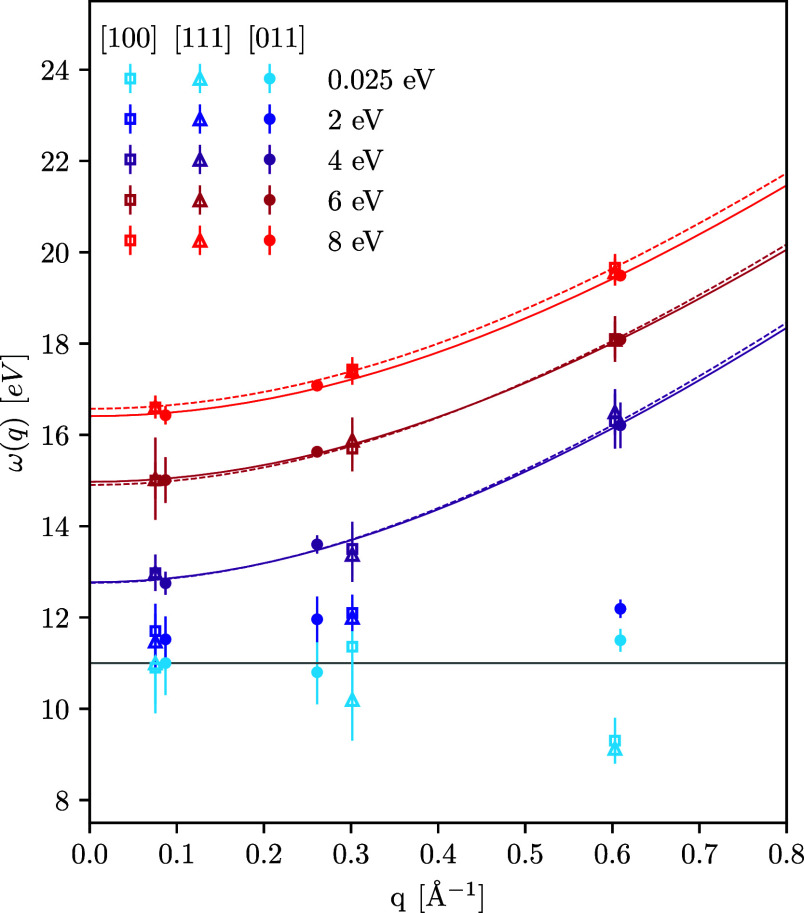
Figure 6.
Dependence of the plasmon frequency on the wavenumber along different crystallographic directions at T = 0.025, T = 2, T = 4, T = 6, and T = 8 eV. Solid (dashed) lines show Bohm–Gross-type quadratic dispersion fits [cf. eq 6] for the direction [111] ([100]) at T = 4, T = 6, and T = 8 eV. In Bohm–Gross dispersion (6), we used for [111] ([100]) α = 1.66ω2p (α = 1.7ω2p) at T = 4 eV, α = 1.24ω2p (α = 1.3ω2p) at T = 6 eV, and α = 1.11ω2p (α = 1.25ω2p) at T = 8 eV. The horizontal solid gray line at 10.864 eV indicates the plasmon energy computed using the free-electron gas model, i.e., assigning the 3d shell as a core state [e.g., see ref (29)].

