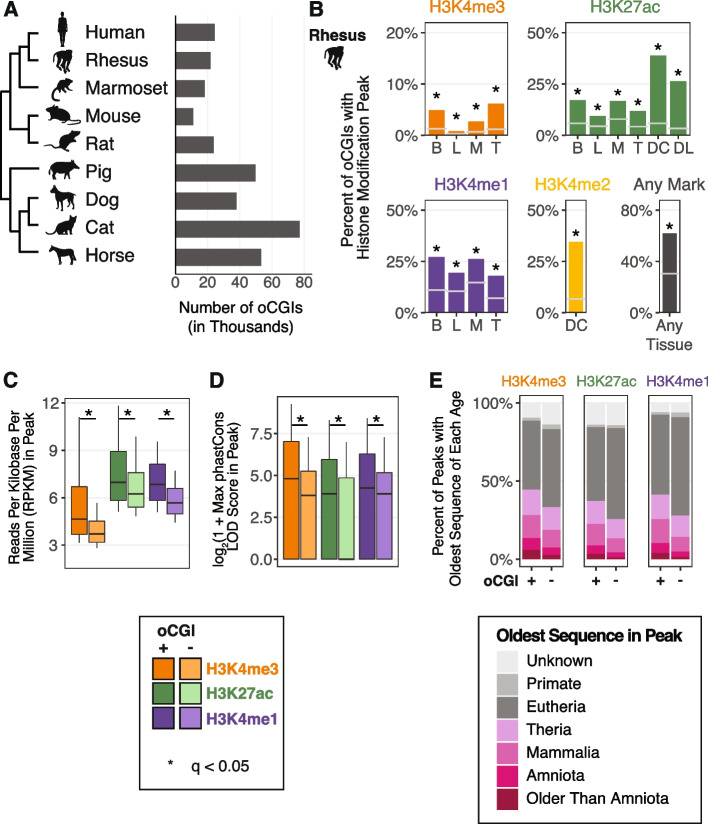
Fig. 1.
oCGIs are enriched for enhancer-associated histone modifications. A The number of oCGIs identified in nine mammalian genomes considered in this study. B Percent of oCGIs overlapping a histone modification peak for each indicated histone modification and tissue in rhesus macaque [31, 34, 36]. B = adult brain, L = adult liver, M = adult muscle, T = adult testis, DC = developing cortex, DL = developing limb. Gray horizontal lines indicate the expected overlap and stars indicate significant enrichment (q < 0.05, BH-corrected, determined by permutation test; see “ Methods”). C The level of each indicated histone modification in peaks with and without oCGIs, measured in reads per kilobase per million (RPKM). Box plots show the interquartile range and median, and whiskers indicate the 90% confidence interval. Stars indicate a significant difference between peaks with and without an oCGI (q < 0.05, Wilcoxon rank-sum test, BH-corrected). D Maximum phastCons LOD (log-odds) scores in peaks with and without oCGIs. Box plots show the interquartile range and median, and whiskers indicate the 90% confidence interval. Stars indicate a significant difference between peaks with and without an oCGI (q < 0.05, Wilcoxon rank-sum test, BH-corrected). E Evolutionary origin of peaks with and without oCGIs. Bar plots show the percentage of peaks with and without oCGIs whose oldest sequence belongs to each age category. The results shown in panels (C) through (E) were generated using peaks from adult brain in rhesus macaque; see Additional File 1: Figs. S8, S10, and S12 for results from additional species and tissues

