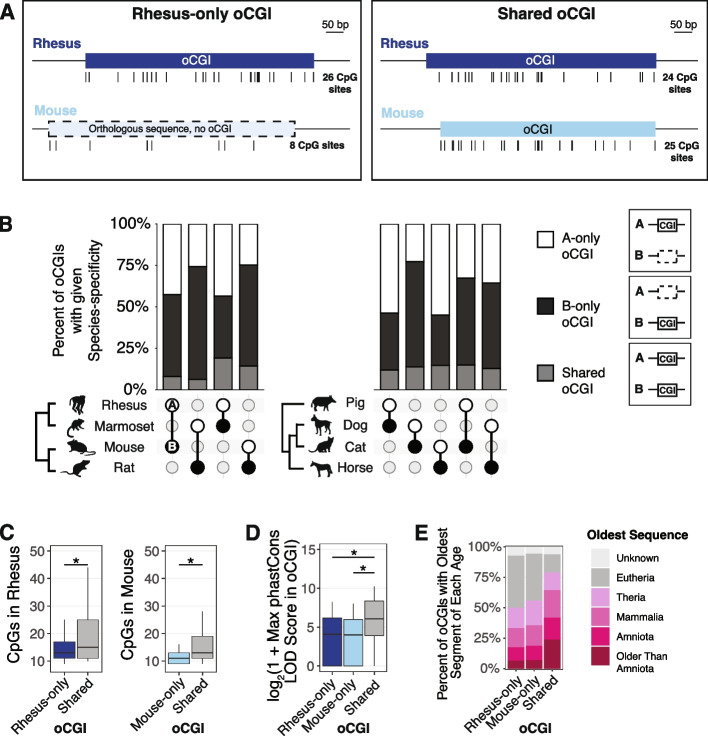
Fig. 2.
oCGIs show extensive turnover across species. A Schematic illustrating how we defined species-specific oCGIs in pairwise comparisons, using rhesus macaque and mouse as an example. Left: a rhesus-only oCGI (the sequence is present in both rhesus and mouse, but the oCGI is only present in rhesus). Right: a shared oCGI (both the sequence and oCGI are present in both rhesus and mouse). Ticks under each oCGI represent the locations of CpG dinucleotides. B Percent of oCGIs across the indicated species pairs (species A versus species B) that are “A-only,” “B-only,” or “shared” as described in the main text. The species pair is shown under each bar, with species A denoted by a white circle and species B denoted by a black circle. Percentages of oCGIs that are species A-only (white), species B-only (black), or shared (gray) are shown. C Number of CpG dinucleotides in rhesus-only (dark blue) or mouse-only (light blue) oCGIs compared to shared (gray) oCGIs. Box plots show the interquartile range and median, and whiskers indicate the 90% confidence interval. Stars indicate significant differences (q < 0.05 Wilcoxon rank-sum test, BH-corrected). D Maximum phastCons LOD scores in rhesus-only, mouse-only, and shared oCGIs. Box plots show the interquartile range and median, and whiskers indicate the 90% confidence interval. Stars indicate significant differences (q < 0.05, Wilcoxon rank-sum test, BH-corrected). E Evolutionary origins of rhesus-only, mouse-only, and shared oCGI sequences

