Fig. 3.
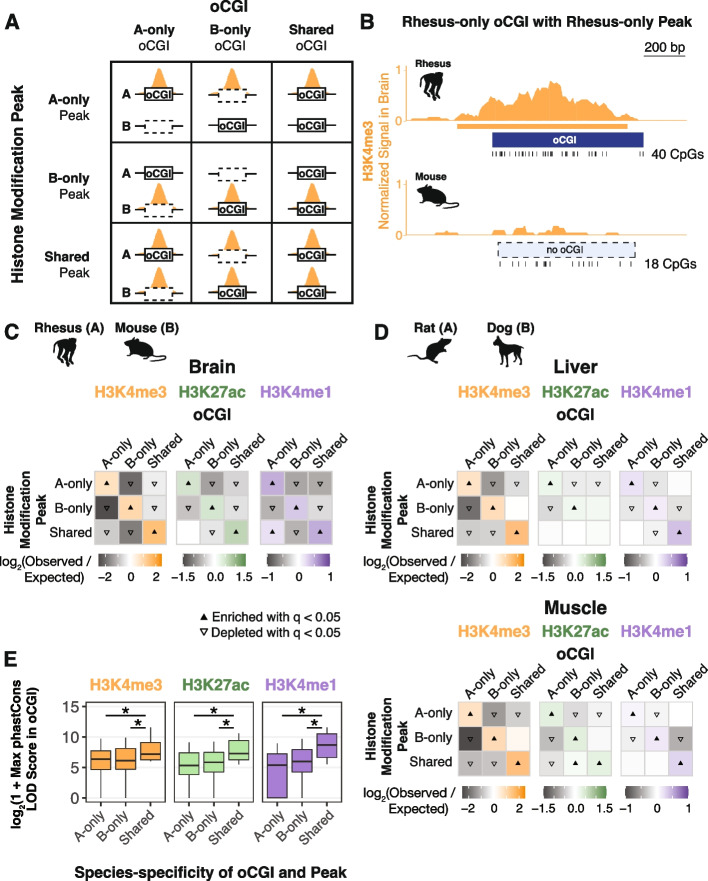
Species-specific oCGIs are significantly enriched for species-specific histone modification peaks. A Schematic illustrating how we defined species-specific and shared oCGIs and peaks. In each pairwise species comparison for each histone modification and tissue, we sorted oCGIs based on their species specificity (designated as A-only, B-only, or shared as in Fig. 2) and the species specificity of their histone modification peaks (shown in orange in the schematic). B An example of a rhesus macaque-specific oCGI overlapping a rhesus-specific H3K4me3 peak in a pairwise comparison with mouse. Ticks show the location of CpG dinucleotides. Normalized H3K4me3 signal at this locus (orange) is shown as read counts per million in adjacent 10-bp bins. C Enrichment and depletion in each indicated comparison of species-specific and shared oCGIs (top: A-only, B-only, Shared) and species-specific and shared peaks (left: A-only, B-only, Shared), compared to a null expectation of no association between oCGI turnover and peak turnover. Each 3 × 3 grid shows the results for a specific test examining oCGIs and their overlap with three histone modifications in adult rhesus macaque brain. Each box in each grid is colored according to the level of enrichment over expectation (orange for H3K4me3, green for H3K27ac, or purple for H3K4me1) or depletion (gray for all marks) of genome-wide sites that meet the criteria for that box. The color bar below each plot illustrates the level of enrichment or depletion over expectation. Filled upward-pointing triangles denote significant enrichment and open downward-pointing triangles denote significant depletion (q < 0.05, permutation test, BH-corrected, see Additional file 1: Fig. S22 and “ Methods”). D Enrichment and depletion in an additional species comparison, rat versus dog, and in additional tissues (liver, top, and muscle, bottom), shown as described in (C). E Maximum LOD score in species-specific oCGIs in species-specific peaks and shared oCGIs in shared peaks, using data from adult rhesus macaque brain. Box plots show the interquartile range and median, and whiskers indicate the 90% confidence interval. Stars indicate significance (q < 0.05, Wilcoxon rank-sum test, BH-corrected)

