Fig. 4.
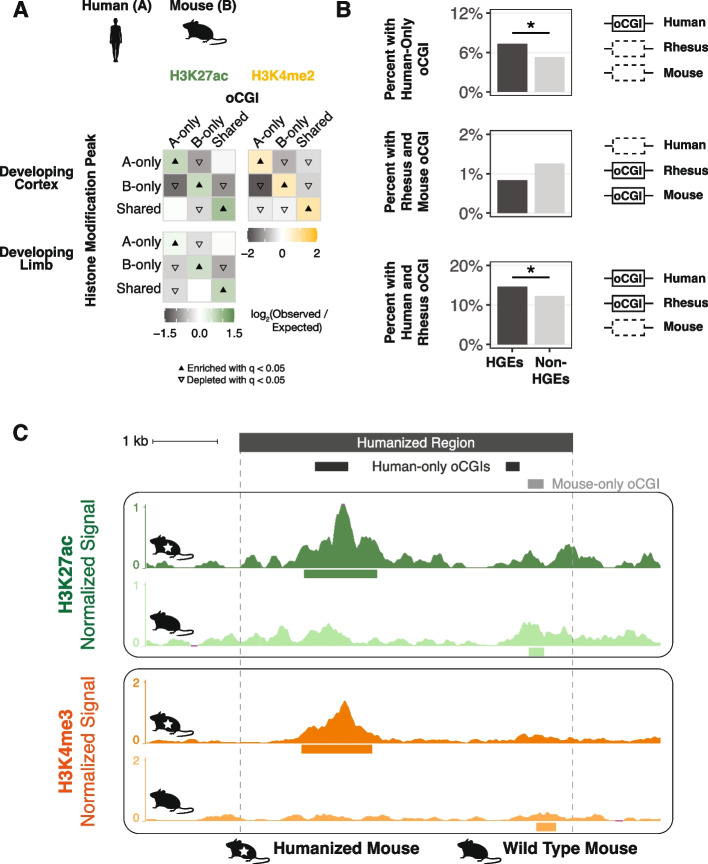
Association of species-specific oCGIs with species-specific histone modification peaks and HGEs in the developing human cortex and limb. A Enrichment and depletion in each indicated comparison of species-specific and shared oCGIs (top: A-only, B-only, Shared) and species-specific and shared peaks (left: A-only, B-only, Shared), compared to a null expectation of no association between oCGI turnover and peak turnover. Results are shown as in Fig. 3C,D, with enrichment in green for H3K27ac and yellow for H3K4me2, and depletion in gray. One representative comparison is shown for developing cortex (8.5 post-conception weeks (p.c.w.) in human versus embryonic day 14.5 in mouse) and developing limb (embryonic day 41 in human versus embryonic day 12.5 in mouse). B Enrichment of specific oCGI species patterns in HGEs compared to non-HGE enhancers in human cortex at 8.5 p.c.w. Bar plots show the percentage of HGEs (left bar) or non-HGE enhancers (right bar) that overlap an oCGI with the species pattern shown on the left. Significance was determined using a resampling test comparing HGEs to non-HGE human enhancers matched for overall histone modification levels (resampling test, BH-corrected; see Additional file 1: Fig. S34 and “ Methods”). C H3K27ac levels in developing diencephalon at the humanized hs754 (top tracks) or wild type (bottom tracks) mouse locus at E11.5. Locations of oCGIs within hs754 and its mouse ortholog are shown at the top (dark gray boxes for two human oCGIs not present in the mouse sequence, and a light gray box for a mouse oCGI not present in the human sequence). Dark green (humanized) and light green (wild type) signal tracks show normalized H3K27ac levels as counts per million reads calculated in adjacent 10-bp bins. Dark orange (humanized) and light orange (wild type) signal tracks show normalized H3K4me3 levels. Peak calls are shown as boxes below the signal tracks. Nominal p-values were obtained by DESeq2 using a Wald test, then BH-corrected for multiple testing across all peaks genome-wide to generate q-values (see values in main text and in Additional file 1: Fig. S38)

