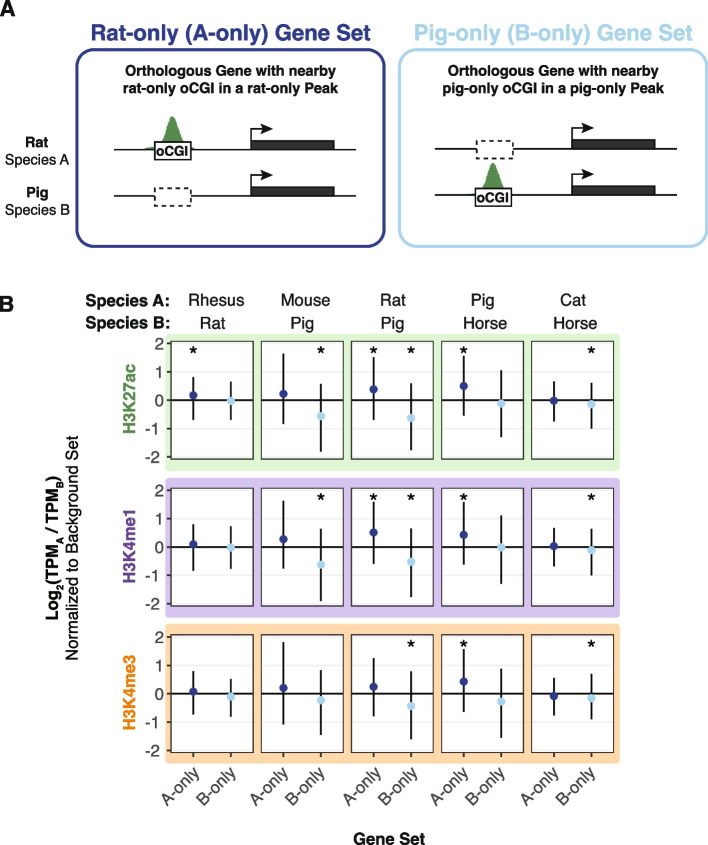
Fig. 5.
Species-specific oCGIs in species-specific peaks are associated with gene expression changes. A Schematic illustrating our method for assigning oCGIs and peaks to genes as described in the text and Additional file 1: Figure S42, using a pairwise comparison of rat and pig as an example. Left: A gene associated with a rat-only oCGI in a rat-only H3K27ac peak, which means the gene is assigned to the “rat-only set” (A-only set) of genes. Right: A gene associated with a pig-only oCGI in a pig-only H3K27ac peak, which means the gene is assigned to the “pig-only set” (B-only set) of genes. B The log2-transformed TPM ratio for genes in the A-only set and the B-only set for each indicated species pair and histone modification using data from adult brain. Points indicate median values for the A-only set (dark blue) and the B-only set (light blue) and lines indicate the interquartile range. All values in the A-only set and B-only set were normalized to the median TPM ratio across resampling rounds from the background set. Stars indicate a significant difference between the observed median and the expected median (q < 0.05, resampling test to compare to the background set, BH-corrected; see Additional file 1: Fig. S42 and “Methods”)

