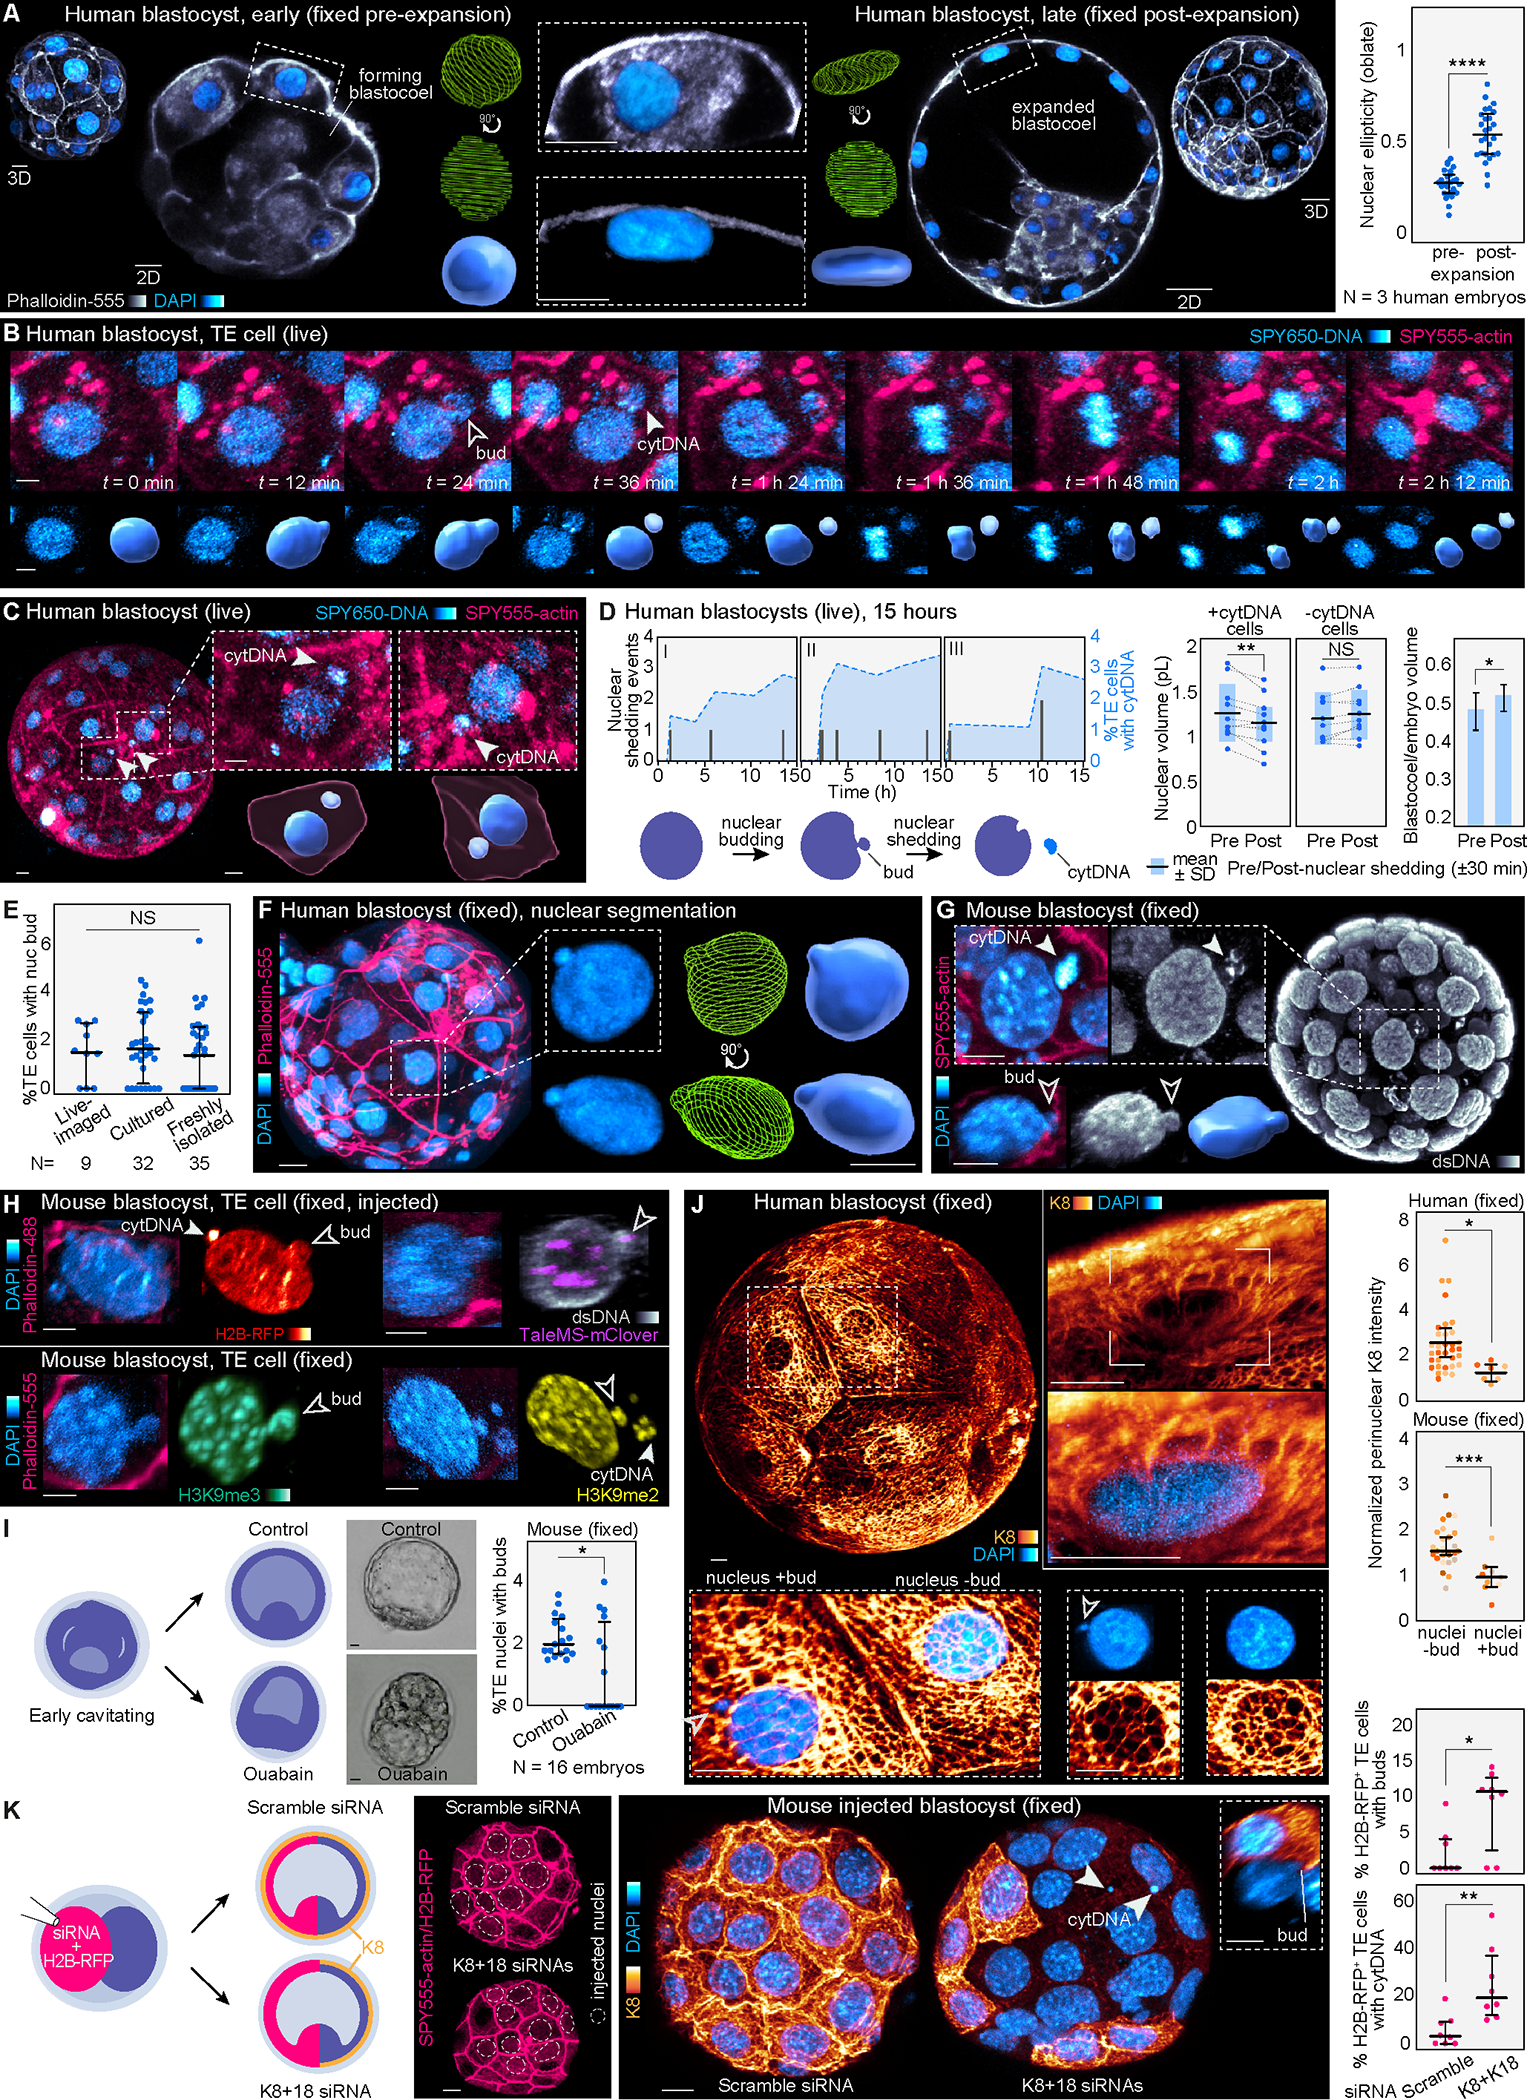
Figure 5. Identification of nuclear budding and DNA shedding.

(A) Images of early and late human blastocysts stained for DAPI and Phalloidin-555. Nuclear segmentation highlights the change in nuclear morphology. Analysis of nuclear morphology in live embryos labeled with SPY650-DNA reveals flattening of trophectoderm nuclei in the expanded human blastocyst (N = 3 human embryos, n = 27 and 26 cells for pre- and post-expansion, respectively; ****P< 0.0001 by two-tailed unpaired t-test).
(B) Live-imaging in human blastocysts demonstrates the appearance of nuclear buds and cytDNA followed by cell division. Lower panels show the SPY650-DNA signal segmented.
(C) Images of live human blastocysts uncover SPY650-DNA–labeled structures within the cytoplasm in expanded blastocysts. Insets show the segmented SPY650-DNA and SPY555-actin signals.
(D) Quantification of nuclear DNA shedding events producing cytDNA in three human embryos over time. Analysis of nuclear and blastocoel volumes pre- and post-DNA loss. Note the reduction in nuclear volume following DNA loss. Neighboring control nuclei (without DNA loss) maintain the same volume (N = 11 DNA loss events in 3 human embryos; **P< 0.01, *P< 0.05, NS = not significant by two-tailed paired student’s t-test). Scheme depicts nuclear budding and cytDNA formation.
(E) Quantification of the percentage of trophectoderm cells with nuclear buds in mouse embryos dyed and live-imaged, cultured without dyes, and freshly isolated and immediately fixed at 4 d.p.c. (N = 9 live-imaged, 32 cultured and 35 freshly isolated embryos, NS = not significant by Kruskal-Wallis test).
(F) Computational segmentation of human trophectoderm nuclei showing nuclear buds.
(G) Detection of cytDNA structures and nuclear buds in an expanded mouse blastocyst fixed and stained with DAPI, and with antibodies against double-stranded DNA.
(H) Immunostaining showing the presence of histone H2B-RFP, the pericentromeric marker TaleMS-mClover, and histone modifications H3K9me2 and H3K9me3 in nuclear buds and cytDNA in trophectoderm cells of expanded mouse blastocysts.
(I) Treatment with ouabain prevents cavity expansion and reduces the percentage of trophectoderm cells with buds (N = 16 mouse embryos per group; *P< 0.05 by Mann-Whitney U test).
(J) Human blastocyst showing keratin network around most trophectoderm cell nuclei. Higher magnification images highlight the cage-like organization of keratin filaments surrounding the nucleus. Analysis of K8 fluorescence intensity shows lower perinuclear K8 levels in cells with nuclear buds (N = 3 human and 7 mouse embryos labeled by color, n = 33 and 7 cells (human) and n = 26 and 9 cells (mouse); ***P< 0.001, *P< 0.05, by Mann-Whitney U test).
(K) siRNAs for K8+K18 injected in half of the embryo disrupt the keratin network and cause an increased number of cells with nuclear buds and cytDNA compared to scramble siRNA-injected embryos (N = 8 embryos per group, **P< 0.01, *P< 0.05, by Mann-Whitney U test). Dashed circles show injected nuclei confirmed by H2B-RFP signal. Inset shows a nuclear bud in a knockdown cell.
Graphs show median with interquartile range. The zona pellucida was masked out in human live embryos to improve visualization. Scale bars, 10 μm
See also Figures S5–S7, and Videos S4–S6.
