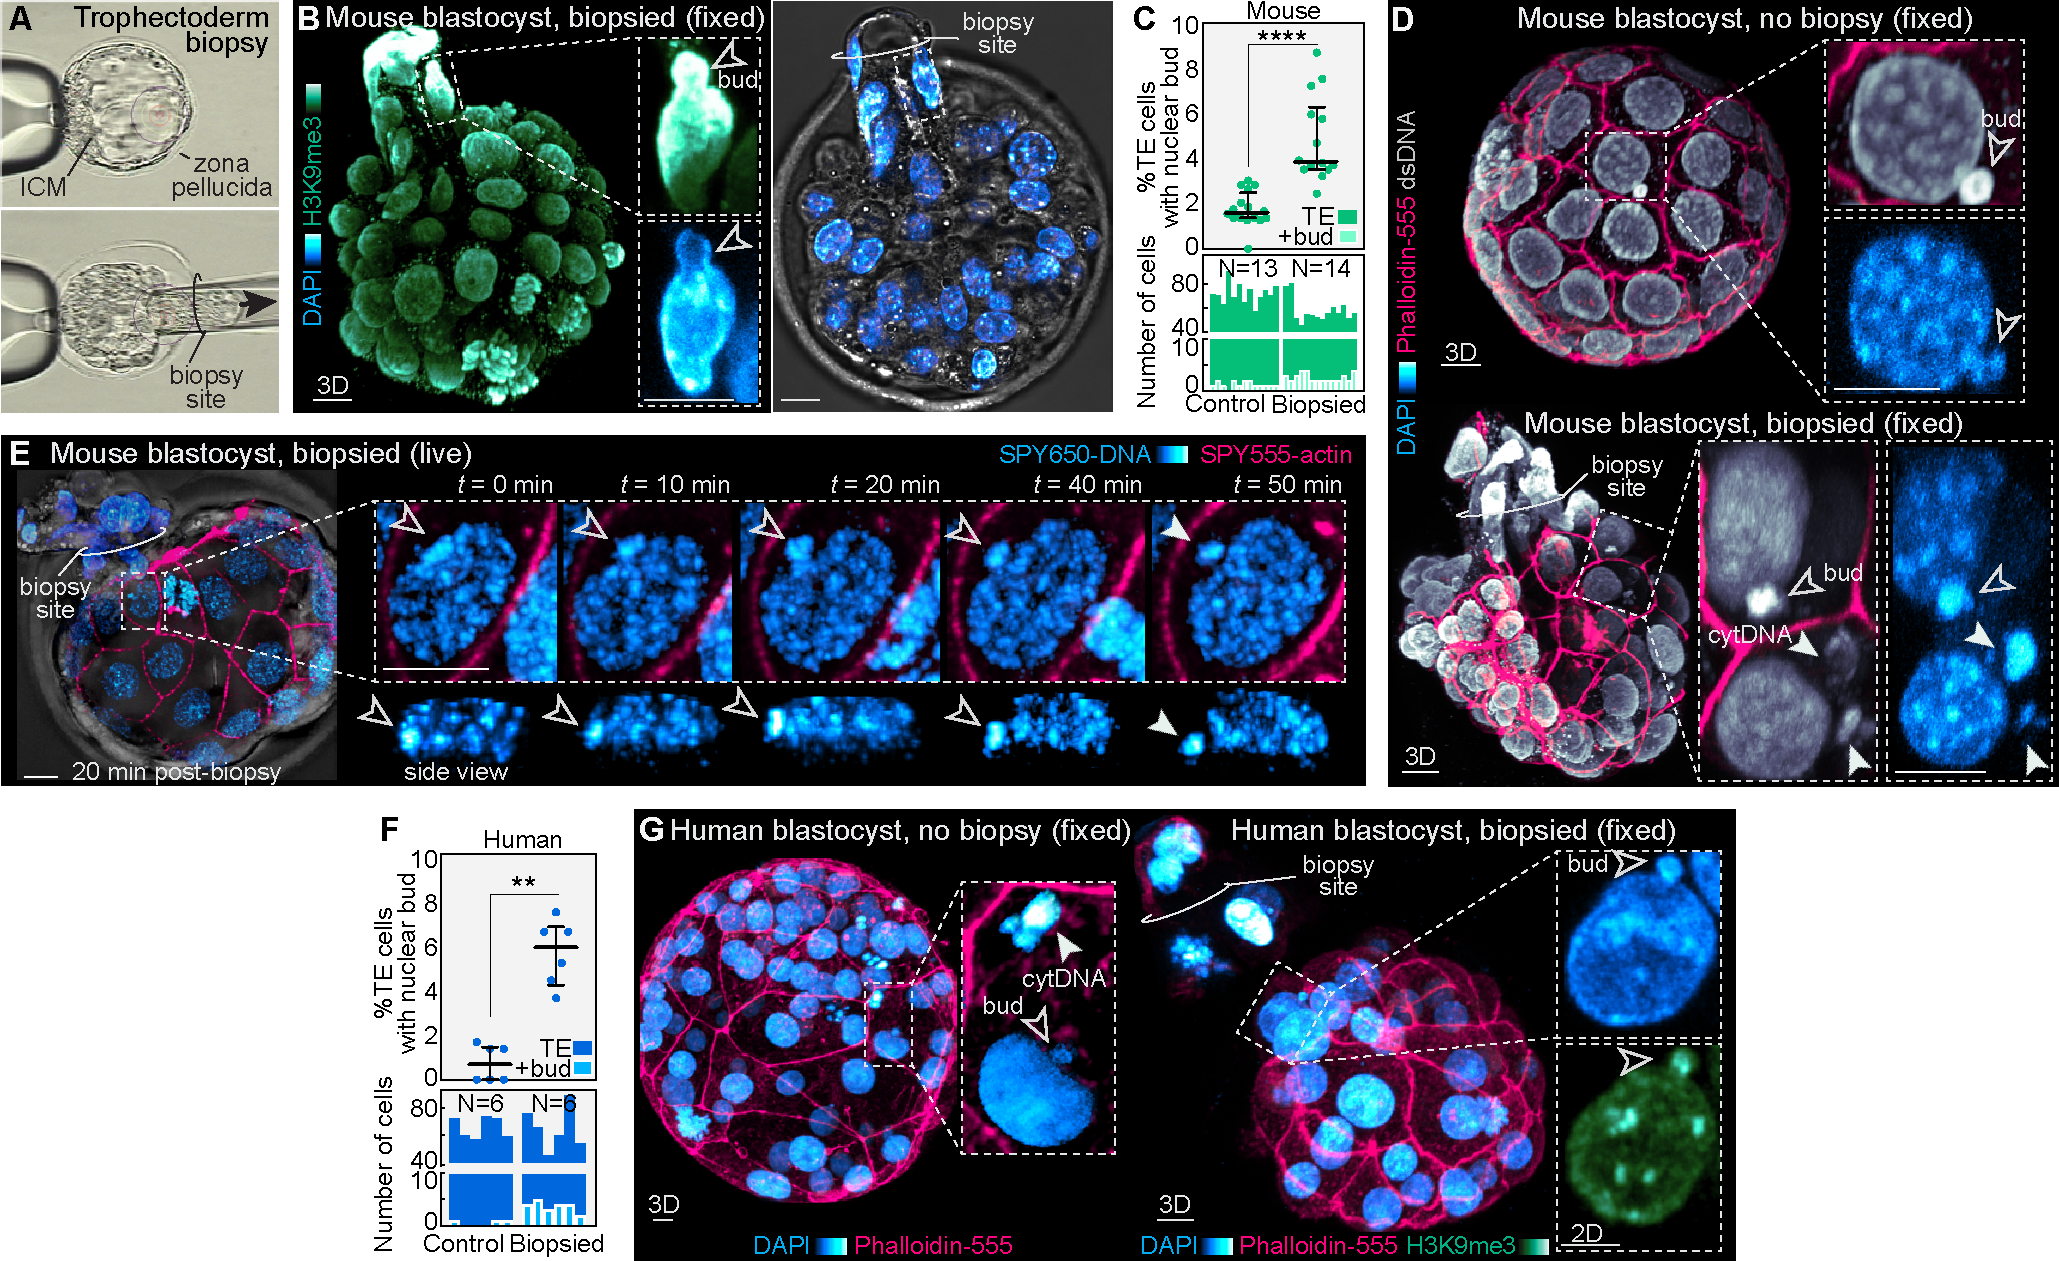
Figure 6. Trophectoderm biopsy causes nuclear budding.

(A) Example of biopsy procedure performed on a mouse blastocyst.
(B) Representative image of a fixed biopsied embryo labeled for H3K9me3 and DAPI reveals nuclear buds.
(C) and (D) Analysis shows an increased percentage of trophectoderm cells with nuclear buds in biopsied versus non-biopsied mouse blastocysts, visualized by DAPI staining and immunofluorescence for double-stranded DNA. Dot plot of percent trophectoderm cells with nuclear buds above and bar graph depicting absolute number of trophectoderm cells with nuclear buds per embryo below. Each bar represents one embryo (N = 13 control and 14 biopsied mouse embryos; ****P< 0.0001 by Mann-Whitney U test).
(E) Live-imaging of a mouse blastocyst labeled with SPY650-DNA and SPY555-actin 20 min post-biopsy reveals the appearance of nuclear buds and generation of cytDNA structures.
(F) and (G) Analysis of biopsied human embryos reveal a similar increase in nuclear budding (N = 6 human embryos per group; **P< 0.01 by Mann-Whitney U test).
Graphs show median with interquartile range. Scale bars, 10 μm.
