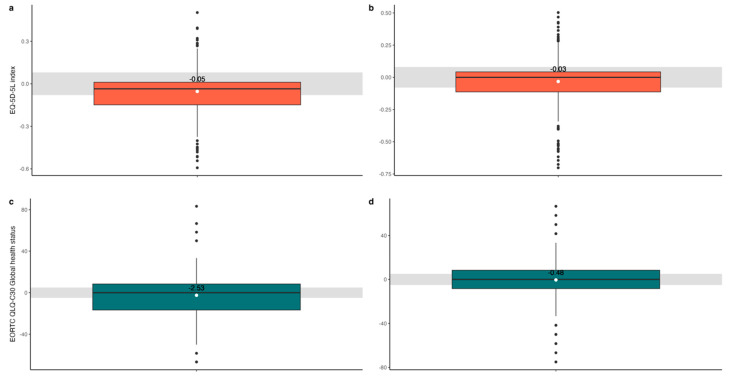
Figure 2.
Boxplots of delta 1 (a) and delta 2 (b) for the EQ-5D-5L index (red) and of delta 1 (c) and delta 2 (d) for the EORTC QLQ-C30 Global health status (blue). The horizontal line in each boxplot represents the median value, while the white dot indicates the mean. The number within the boxplot represents the mean delta value. The grey interval represents the MCID of the EQ-5D-5L (0.08) and of the EORTC QLQ-C30 (5).

