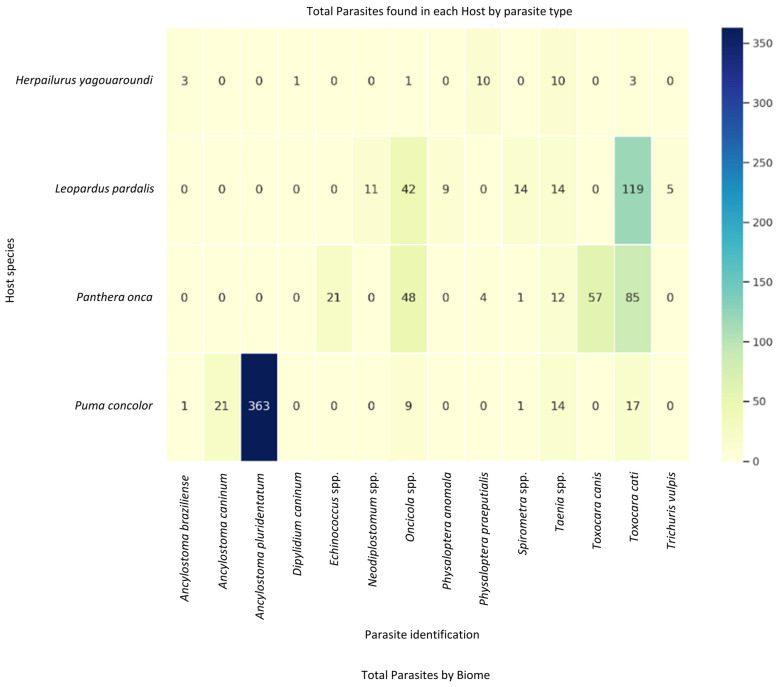
Figure 3.
Heatmap of total parasites found in each host by parasite type and a bar plot of total parasites by biome. Light yellow indicates lowest range of parasite counts, indicating relatively minor infections, and dark blue represents the highest rang of parasite counts, indicating severe infections.

