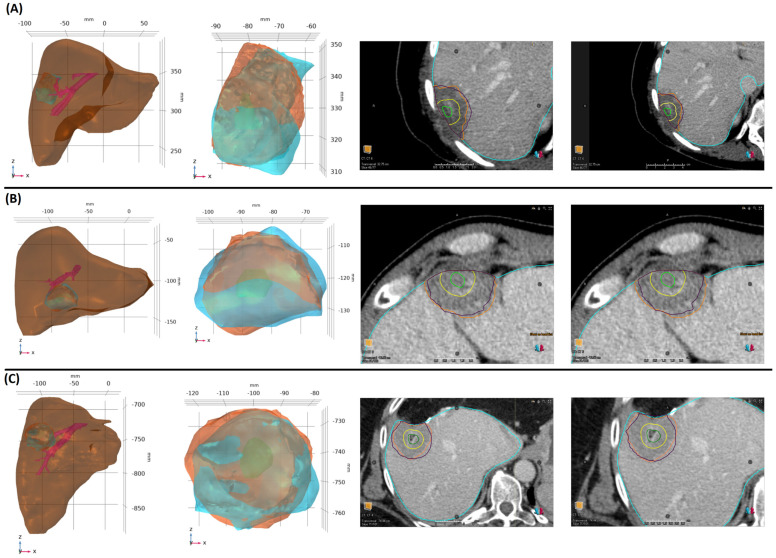
Figure 5.
Patient-specific 3D models for patient 1 (A), patient 2 (B), and patient 3 (C). In each panel, the first image from the left shows the liver, tumor, and blood vessels, and the second image shows the clinical ablation zone (blue), computational ablation zone (orange), and tumor (green). The third and fourth images are post-ablation CT images showing the liver (blue), tumor (green), 5 mm MAM (yellow), clinical ablation zone (orange), and predicted ablation zone (purple) for ablation times of 10 min and 9.5 min, respectively.

