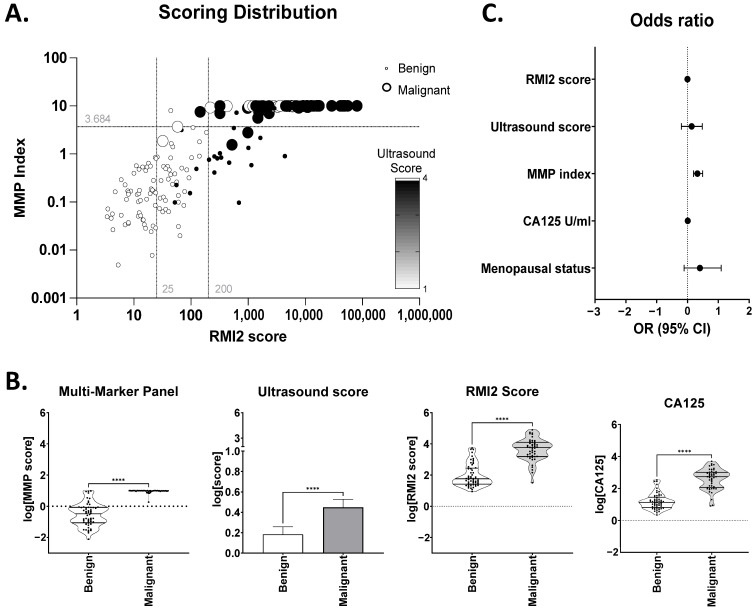
Figure 1.
Relationship between Ultrasound, RMI2 score and MMP index. (A) MMP index vs. RMI score were plotted for each patient. Each data point was coloured according to ultrasound score of 1 (white) or 4 (black). Circle size indicates benign (small) or malignant (large) status. Grey lines indicate RMI score cut-off values at 25 and 200. (B) Comparison of each MMP index, ultrasound score, RMI2, and CA125 between benign and malignant samples. **** p ≤ 0.0001. (C) Odds ratio +/− 95% confidence intervals for parameters considered in logistic regression modelling.

