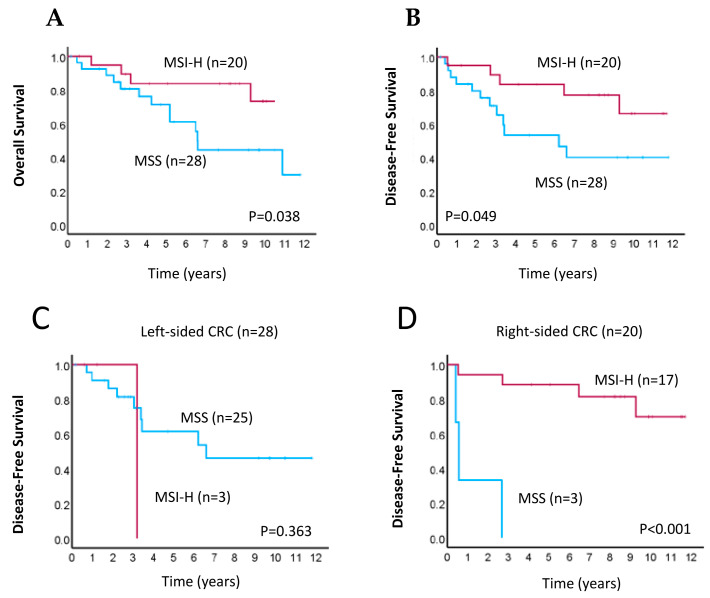
Figure 3.
Kaplan–Meier survival analyses for CRC patients according to MSI status. (A,B) Kaplan–Meier curves of overall survival (A) and disease-free survival (B) in patients with MSI-high (MSI-H; pink line) or microsatellite-stable (MSS; blue line) tumors. (C,D) Kaplan–Meier curves of disease-free survival in patients with MSI-H (pink line) or MSS (blue line) tumors for those with left-sided (C) and right-sided (D) primary CRC.

