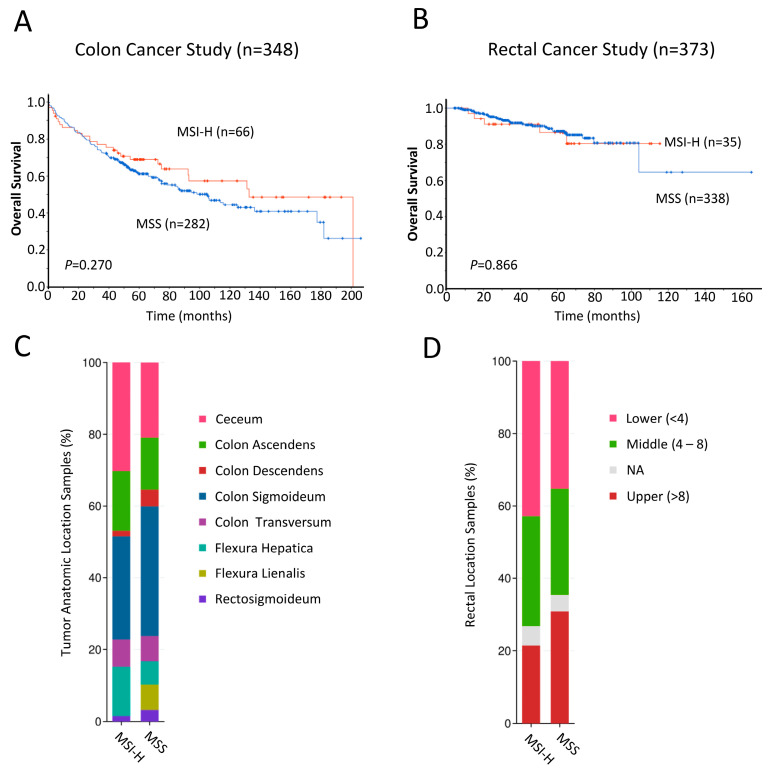
Figure 4.
(A,B) Kaplan–Meier analyses comparing overall survival of n = 348 colon cancer (A) and n = 378 rectal cancer (B) patients from the cBioPortal for Cancer Genomics (http://www.cBioPortal.org, accessed on 30 November 2023 [31,32]) with MSI-high (red line) and MSS (blue line). Differences between groups were analyzed using the log-rank test, and p-values are shown. (C,D) Bar plot showing the proportions of MSI-H and MSS samples arising from various primary tumor locations in the colon cancer (C) and rectal cancer (D) cohorts.

