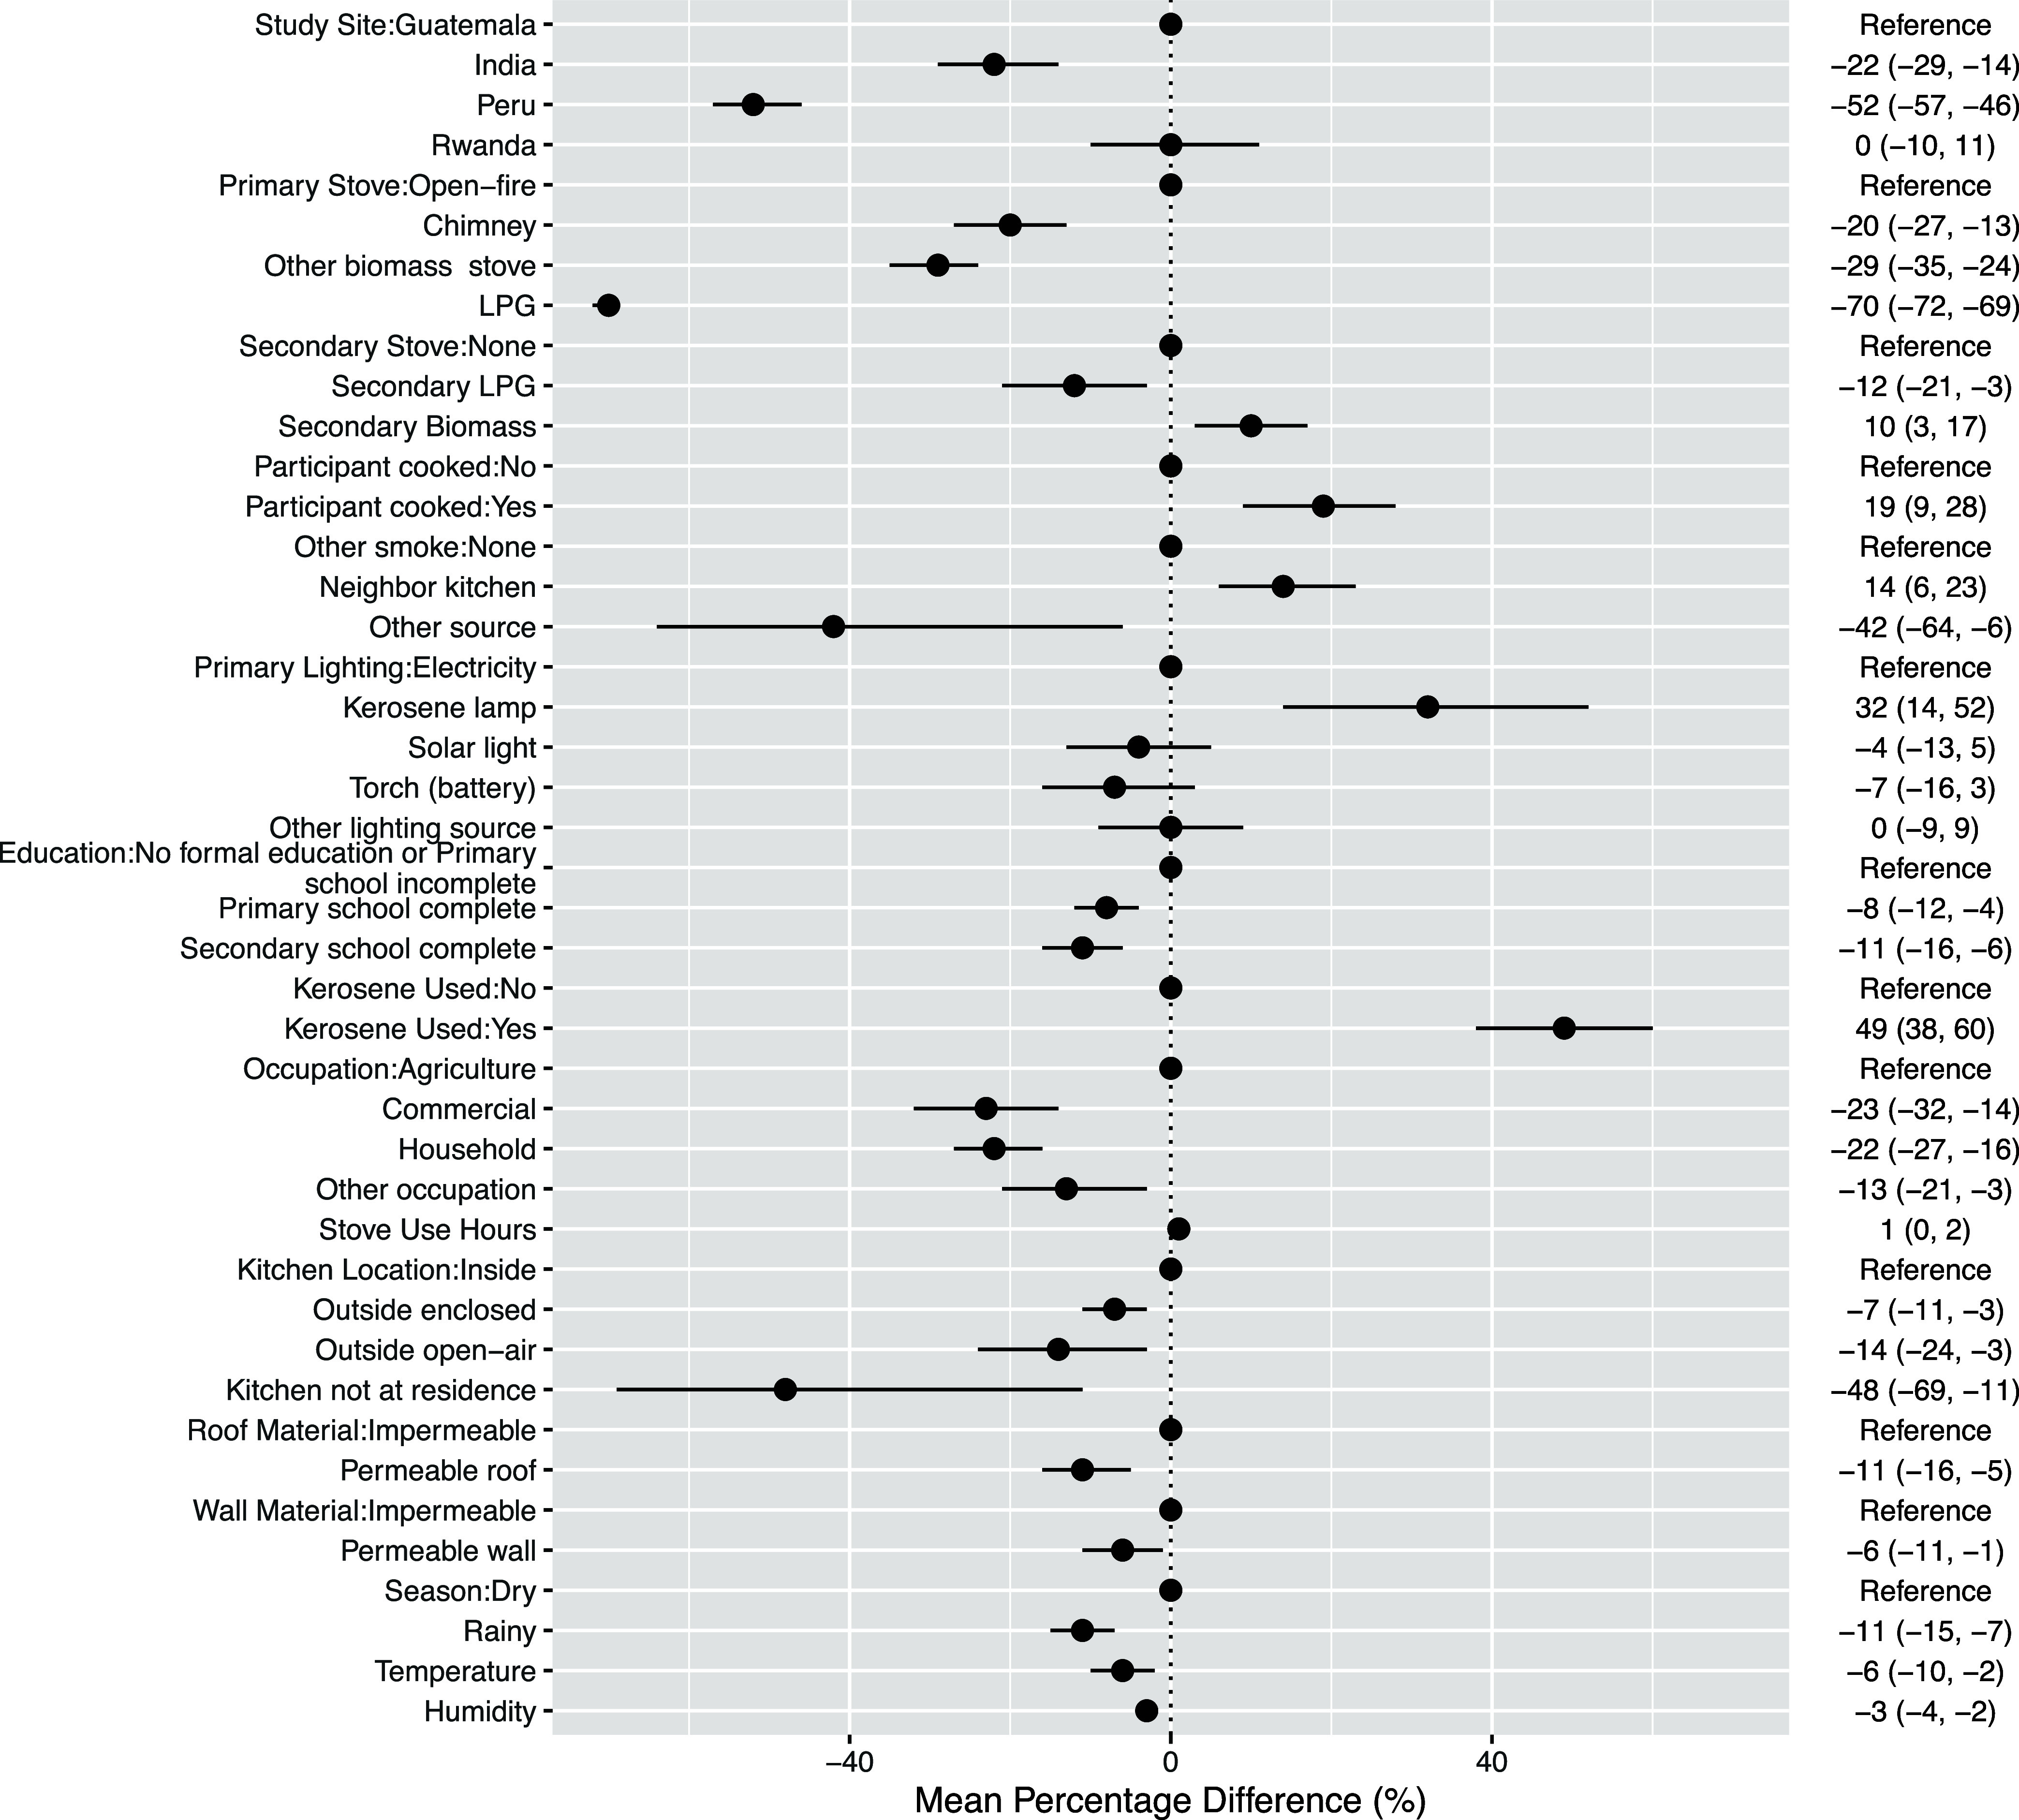
Figure 1.

HAPIN-wide multivariable mixed-effects regression coefficients (with 95% confidence intervals). Numeric coefficients represent the mean percentage change of the geometric mean in BC exposure compared to the reference category based on the final multivariable linear regression models. Coefficients for relative humidity and kitchen volume represent a 5 unit increase in percentage and 10 unit increase in volume, respectively.
