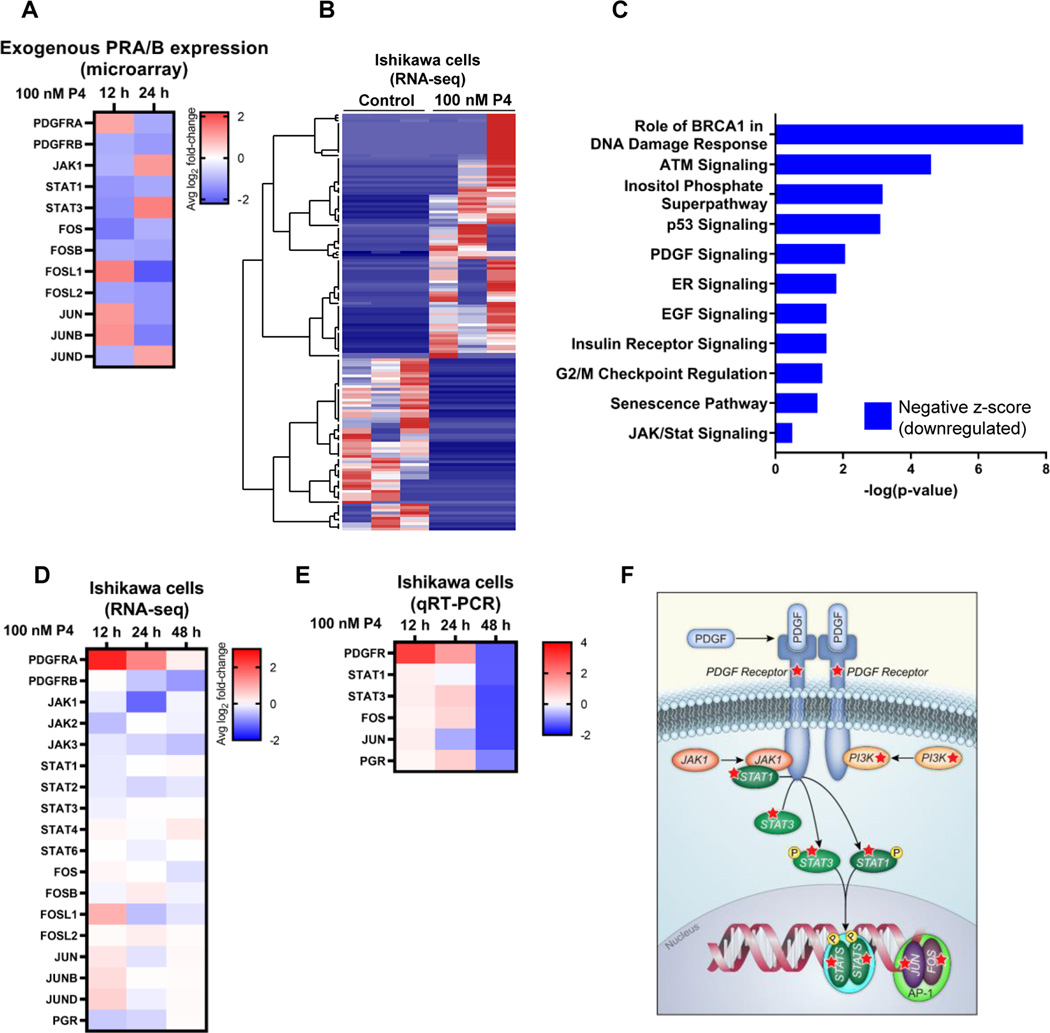
Figure 1. Significantly altered pathways in endometrial cancer cells response to progesterone.
(A) Heatmap of representative Affymetrix microarray data from Hec50co cells expressing exogenous PRA and PRB. Gene expression changes in response to 100 nM progesterone (P4) were compared to vehicle control. (B) Heatmap of unsupervised clustering analysis of RNA-seq data. Ishikawa cells were treated with 100 nM progesterone or vehicle control for 12 h, followed by analysis of gene expression by RNA-seq. Each column represents a biological replicate (N=3 per treatment) and each row represents a gene. (C) Ingenuity Pathway Analysis (IPA) of significantly altered pathways based on RNA-seq data from Ishikawa cells treated with P4 or vehicle control for 24 h. (D) Heatmap of representative differential gene expression from RNA-seq data from Ishikawa cells treated with either progesterone or vehicle control. (E) Heatmap of qRT-PCR of Ishikawa cells treated with P4 or vehicle control. (F) Schematic representation of the PDGFR/JAK/STAT/Fos/Jun pathway. Red stars indicate proteins in the pathway encoded by genes inhibited by progesterone. Heatmaps reflect the log2 fold-change in gene expression relative to time-matched vehicle control. Values less than 1 indicate a decrease in transcript levels in response to progesterone, whereas values greater than 1 indicate an increase. Results are the average of N=3 biological replicates.

