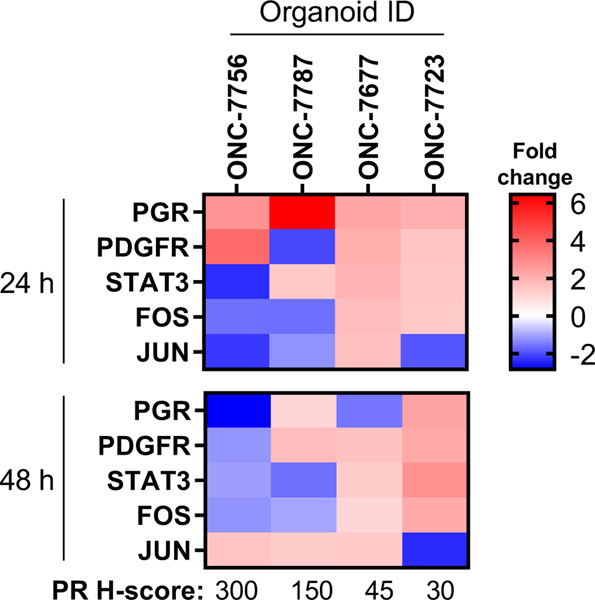
Figure 3: Gene expression changes in PDO models following progesterone treatment.
Expression of the indicated genes was assessed in PDO models exposed to progesterone (P4) for 24 h or 48 h. Log2 fold-changes were calculated vs. vehicle control at the same time point and visualized as a heatmap. Data are the average of N=3 biological replicates.

