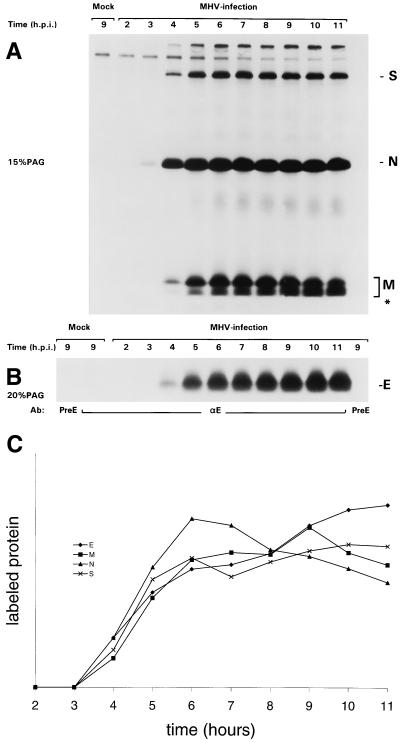
FIG. 2.
Kinetics of appearance of the E protein in MHV-A59-infected cells. MHV-infected and mock-infected OST7-1 cells were labeled with 35S-labeled amino acids (80 μCi/10-cm2 dish) for different 1-h periods starting at the indicated times after infection. Combined lysates of cells and culture media were then prepared, and immunoprecipitations were carried out with different antisera. (A) Proteins precipitated with the polyclonal anti-MHV serum were analyzed in 15% PAG. (B) Proteins precipitated by the anti-E (αE) or the preE serum were analyzed in 15% PAG. Radioactivities in the bands representing the different viral proteins were quantitated, taking for M all the different forms, including the lower band indicated by an asterisk. The results are compiled in panel C. They were normalized by placing the added total of all measurements for each protein at 100 and expressing each measurement as the fraction of this total.

