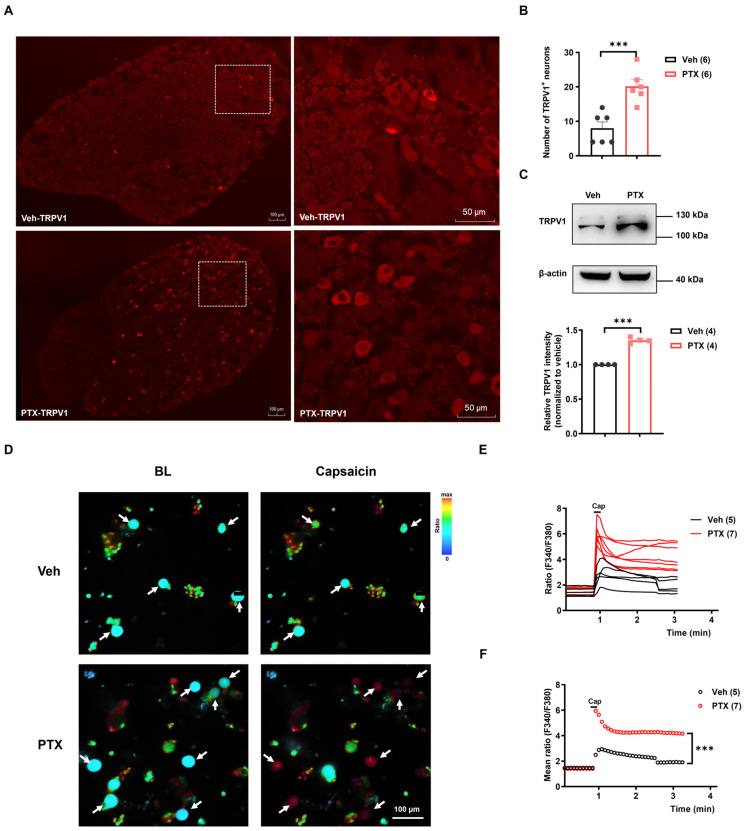
Figure 2.
Upregulation of TRPV1 expression and function following paclitaxel treatment. (A) Representative immunostaining images of TRPV1 on day 14 post-Veh and PTX injection. The scale bars represent 100 μm (left panel) and 50 μm (right panel). (B) Quantitative analysis of TRPV1-positive neurons within the fixed area (1 mm2). Data were analyzed using an unpaired t-test. *** p < 0.001, n = 6. (C). Western blot analysis of TRPV1 protein levels in DRG on day 14 following Veh and PTX treatment. TRPV1 expression levels were normalized to β-actin. The histograms display the statistical analysis of the relative TRPV1 protein levels in Veh and PTX groups. Data were analyzed using an unpaired t-test. *** p < 0.001, n = 4. (D) Images of dissociated L4–L5 DRG neurons from Veh and PTX groups before and after capsaicin (Cap) stimulation. Neurons responsive to capsaicin are indicated by arrows. The scale bars represent 100 μm. (E) Changes in the F340/F380 ratio in Cap-responsive neurons in Veh and PTX groups. (F) Statistic analysis of the mean F340/F380 ratio in Cap-responsive neurons in Veh and PTX groups. Data were analyzed using a two-way ANOVA followed by the Bonferroni post hoc test (3 independent experiments). *** p < 0.001. n = 5, 7 in panels (E,F). Veh: vehicle, BL: baseline, PTX: paclitaxel.

