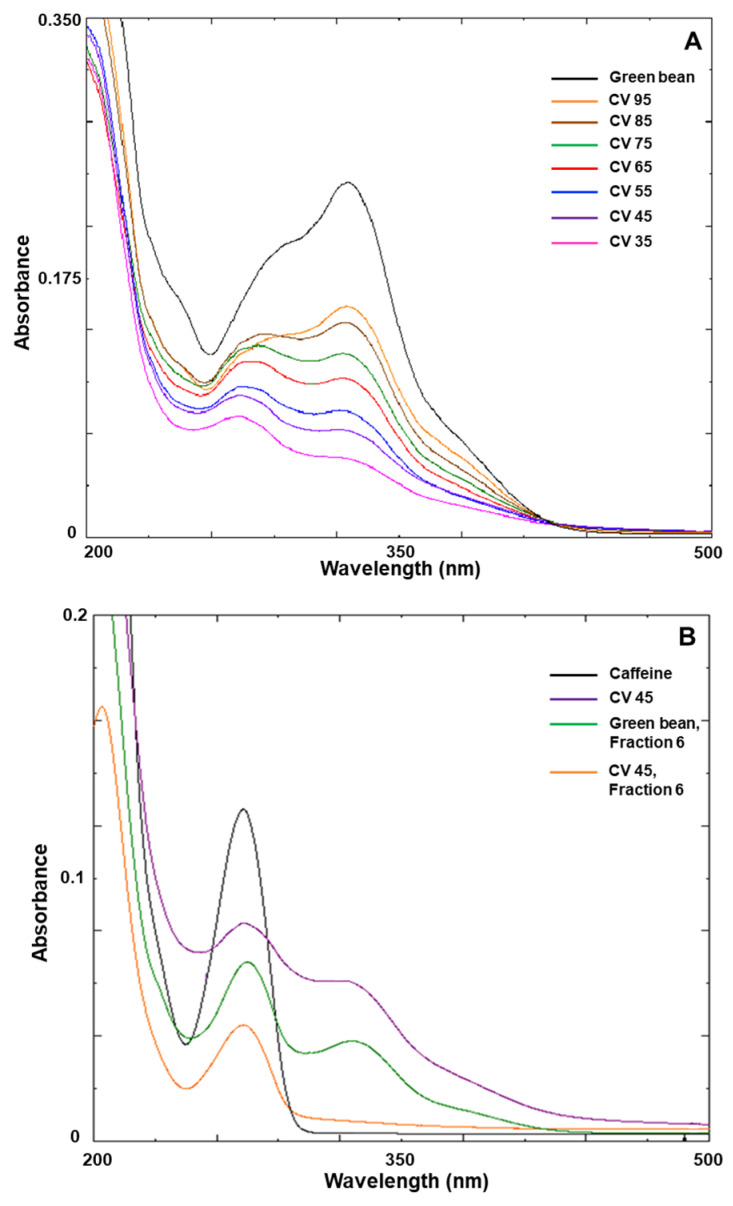
Figure 4.
(A) UV–Vis absorption spectra of coffee bean extract according to roasting degree; (B) UV–Vis absorption spectra of caffeine and chlorogenic acid. Each spectrum represents standard caffeine (black), extract of coffee bean with a chromaticity value of 45 (purple), high-performance liquid chromatography (HPLC) fraction 6 of green bean extract (green), and HPLC fraction 6 of extract of coffee bean with a chromaticity value of 45 (orange). A 100-fold dilution of the stock solution containing 2.5 mg/mL caffeine was used for absorbance measurement. CV, chromaticity value.

