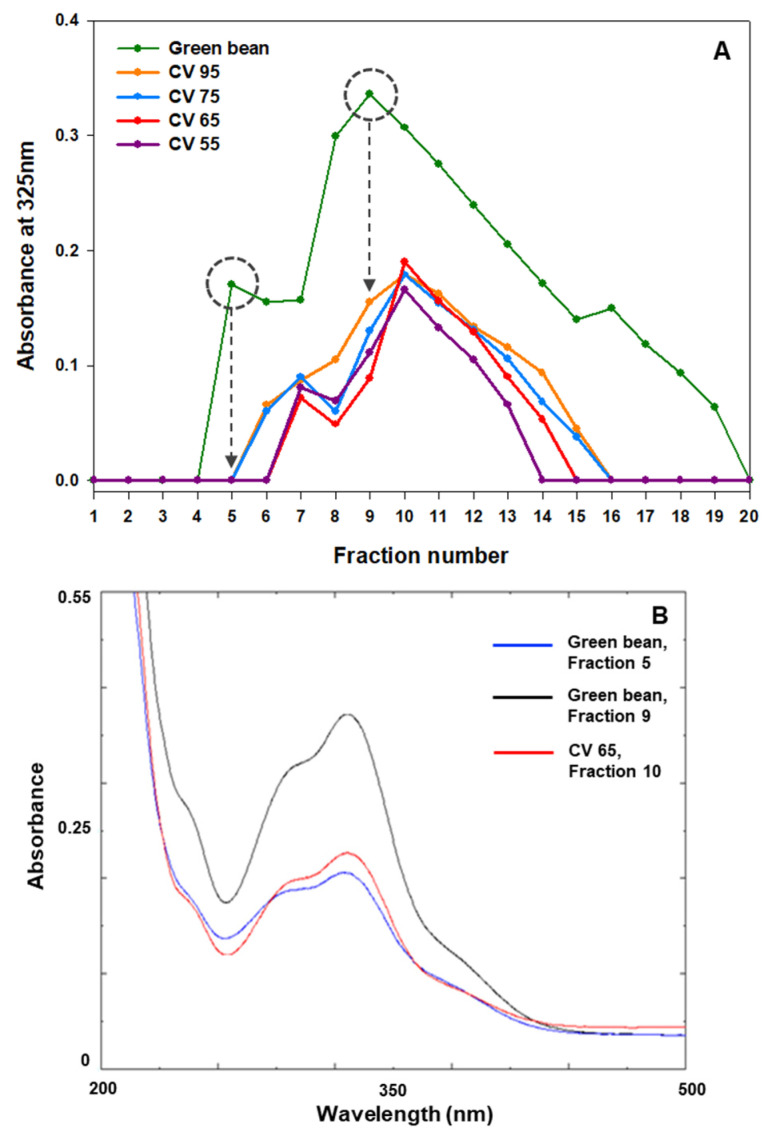
Figure 6.
(A) HPLC fraction graph showing the thermal stability of chlorogenic acid present in green and roasted coffee bean extracts plotted at 325 nm using a UV–Vis spectrophotometer; (B) UV–Vis absorption spectra of fractions 5 (blue) and 9 (black) of green coffee bean extract, and fraction 10 (red) of coffee bean extract with a chromaticity value of 55 recovered from HPLC. The HPLC fraction volume was 1.5 mL each. CV, chromaticity value.

