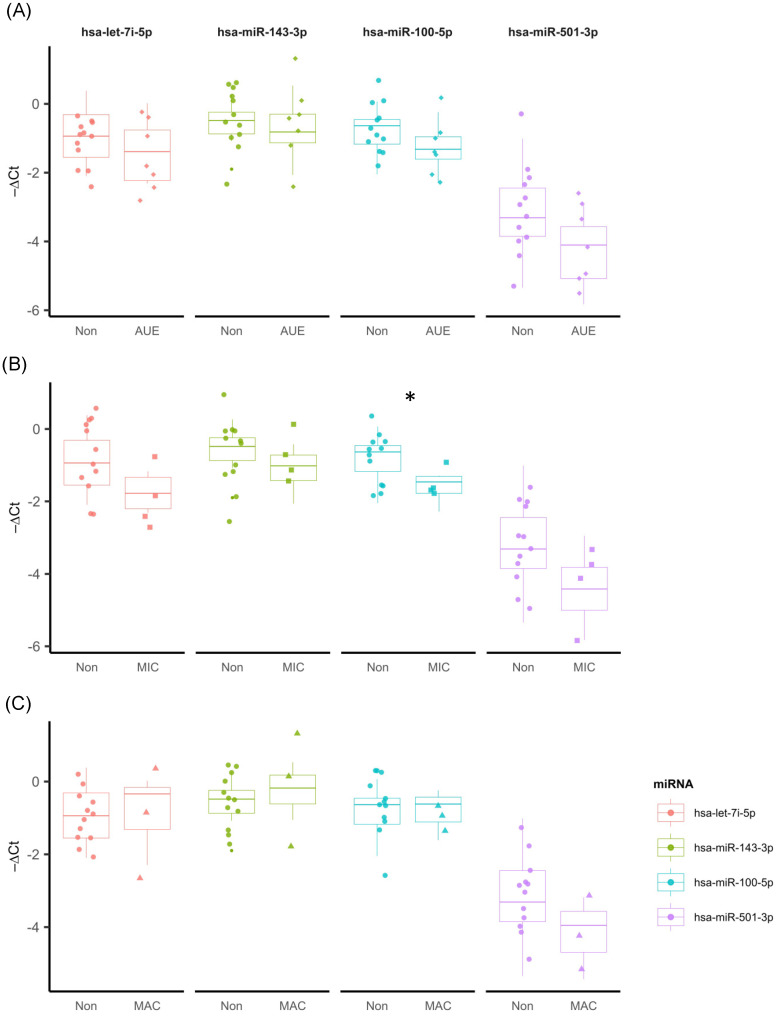
Figure 2.
Expression profiles of the four miRNAs in three different conditions. (A) Non AUE (n = 12) and AUE (n = 7) patients: hsa-let-7i-5p (p = 0.299), hsa-mir-143-3p (p = 0.592), hsa-mir-501-3p (p = 0.068), and hsa-mir-100-5p (p = 0.142). (B) Comparison of −ΔCT values between Non (n = 12) and MIC (n = 4): hsa-let-7i-5p (p = 0.078), hsa-mir-143-3p (p = 0.133), hsa-mir-501-3p (p = 0.133), and hsa-mir-100-5p (p = 0.030) *. (C) Comparison of the average −ΔCT values between the Non (n = 12) and MAC (n = 3) groups for the miRNAs: hsa-let-7i-5p (p = 0.840), hsa-mir-143-3p (p = 0.448), hsa-mir-501-3p (p = 0.233), and hsa-mir-100-5p (p = 1.000).

