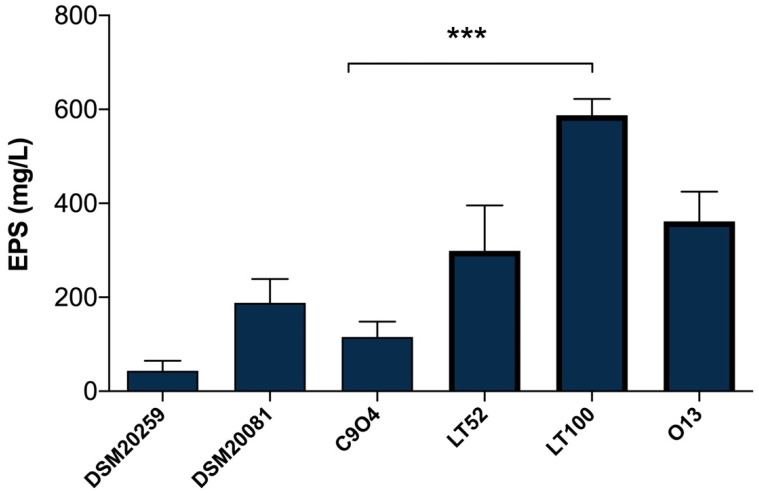
Figure 3.
Quantification of EPSs production in milk samples fermented by DSM20259, S. thermophilus; DSM20081, Lb. delbrueckii subsp. bulgaricus; C9O4, Lpb. plantarum; LT52, Lpb. plantarum; LT100, Lpb. plantarum; and O13, Lpb. plantarum. Data are reported as mean values ± SEM. Statistical analysis was performed by One-Way ANOVA followed by Tukey’s multiple comparisons post hoc test (*** p = 0.0002).

