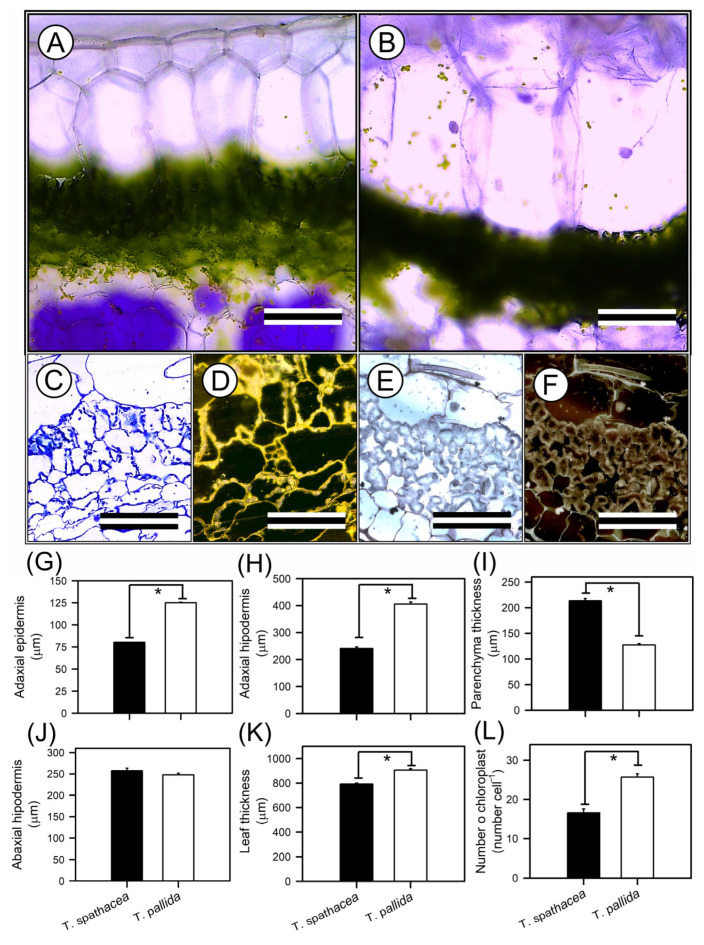
Figure 4.
Representative optical microscopy (OM) images of the top–bottom and anatomical analyses of Tradescantia spathacea (L.) Olof Swartz and Tradescantia pallida (Rose) D.R. Hunt plants. (A,C,D) Cross sections of T. spathacea plants. (B,E,F) Cross-sections of T. pallida plants. (G) Adaxial epidermis. (H) Adaxial hypodermis. (I) Parenchyma thickness. (J) Abaxial hypodermis. (K) Leaf thickness. (L) Number of chloroplasts. Bars with asterisks show significant differences by Student’s t test (p < 0.01). Scale bars = 200 μm and 60 μm, from top to bottom. Mean ± SE. (n = 100).

