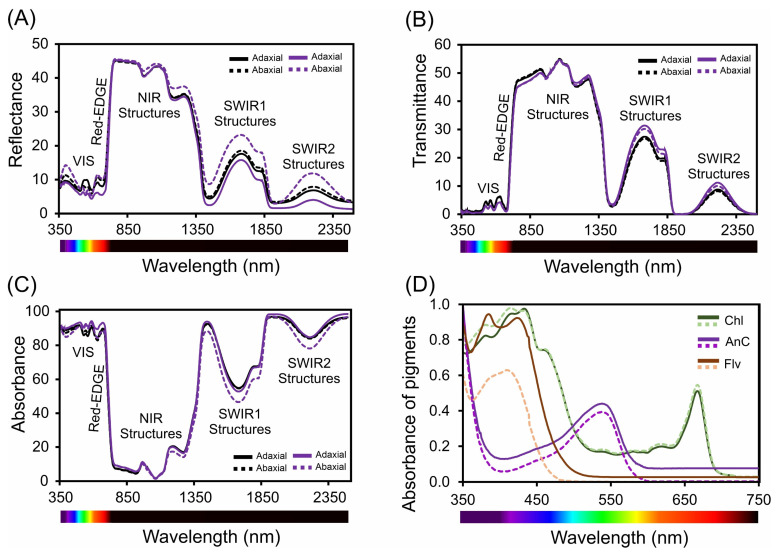
Figure 8.
Spectral analysis of leaves (in vivo) and pigments (in vitro) in Tradescantia spathacea (L.) Olof Swartz and Tradescantia pallida (Rose) D.R. Hunt plants. (A) Reflectance factor (Ref) from 350 to 2500 nm. (B) Transmittance factor (trans) from 350 to 2500 nm. (C) Absorbance factor (Abs) from 350 to 2500 nm. (D) Spectra of chloroplast (chlorophylls and carotenoids) and extrachloroplastidic (anthocyanins and flavonoids) pigments from 350 to 750 nm. The solid and dashed black lines represent the measurements from the adaxial and abaxial surfaces of the leaves of Tradescantia species, respectively. (n = 100).

