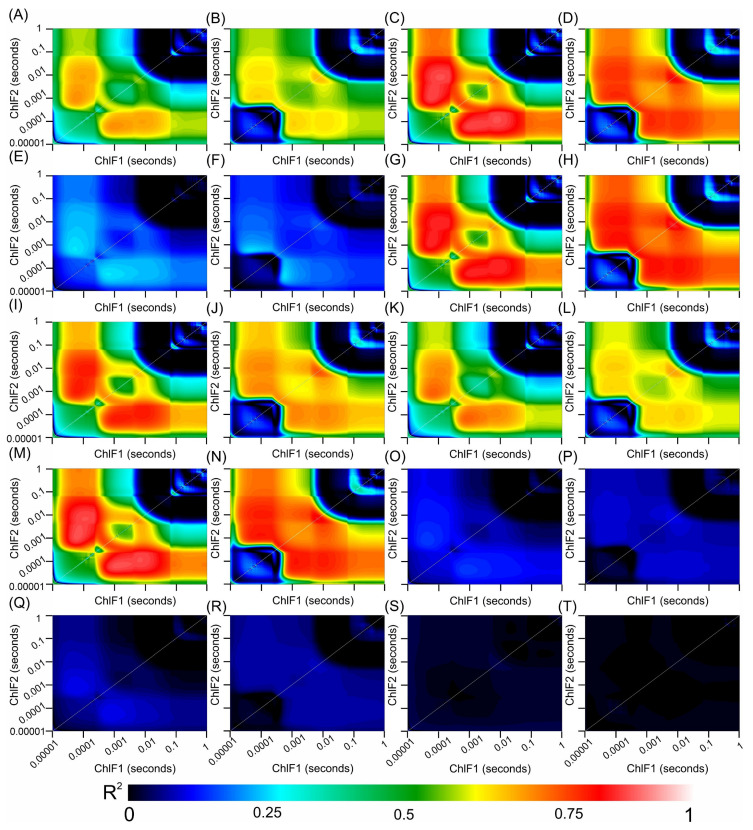
Figure 11.
Counter map for correlation coefficients (R2) from HVI algorithms applied to adaxial and abaxial chlorophyll a fluorescence kinetics data across the range of 350 to 2500 nm for Tradescantia spathacea (L.) Olof Swartz and Tradescantia pallida (Rose) D.R. Hunt plants. The heatmap shows the coefficient of correlation (R2) obtained from linear regression analyses between various biophysical parameters and interactions between wavelengths 1 and 2. (A,B) adaxial epidermis, (C,D) adaxial hypodermis, (E,F) parenchyma thickness, (G,H) abaxial hypodermis, (I,J) leaf thickness, (K,L) number of chloroplasts, (M,N) adaxial cell area surface, (O,P) granum height, (Q,R) thylakoid layers, and (S,T) stacking repeat distance (SRD). The colour gradient, which transitions from dark blue to light red, signifies increasing correlation strength. (n = 200).

