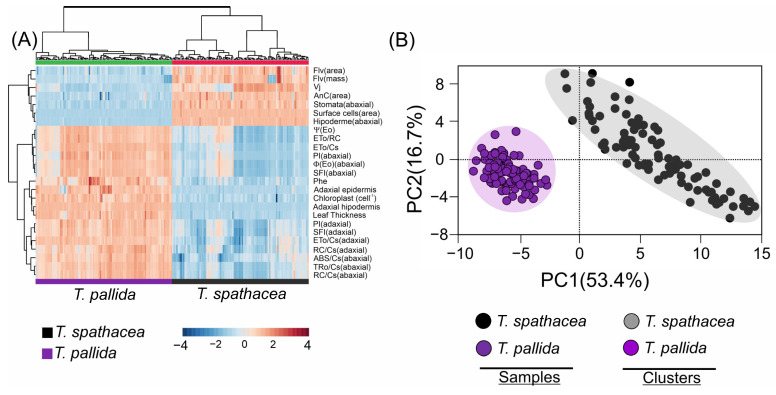
Figure 12.
Cluster heatmap and principal component analysis of Tradescantia spathacea (L.) Olof Swartz and Tradescantia pallida (Rose) D.R. Hunt plants. (A) Cluster heatmap summarising pigments by area and mass, chlorophyll a fluorescence parameter, and adaxial, abaxial, and anatomical parameters. Numerical differences within the data matrix are shown by the Z scores, where blue and red indicate decreased and increased values, respectively. The parameters were clustered in the rows, and sample groups were clustered in the columns by differences between species at independent factors. (B) Principal component analysis and clustering based cluster heatmap factors. (n = 100).

