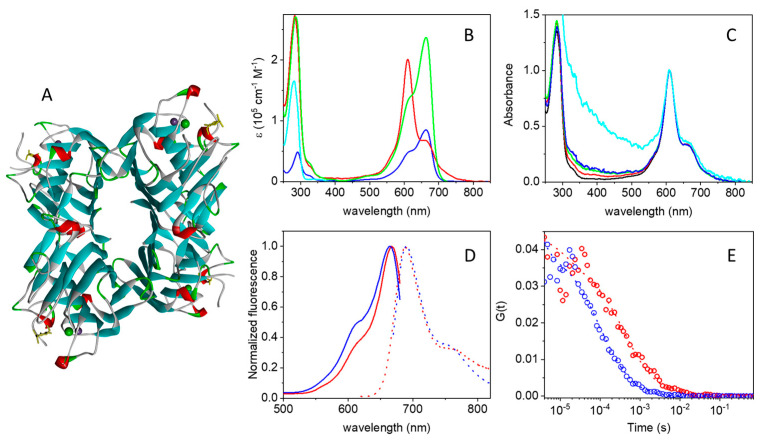
Figure 1.
(A) Cartoon representation of the three-dimensional structure of the tetrameric Concanavalin A (PDB 3qlq). Ca2+ and Mn2+ ions are represented as solid spheres. (B) Molar absorption spectra for strep (cyan), MB (blue), and MB-strep (red). The green curve is obtained as a linear combination of the strep and MB spectra, where the MB spectrum was multiplied by 2.8. (C) Normalized absorption spectra (at 610 nm) for MB-strep in PBS as a function of protein concentration: black 4.6 µM, red 1.1 µM, green 0.55 µM, blue 0.25 µM, cyan 0.175 µM. Although the spectrum collected at the lowest concentration is strongly affected by scattering, the proportion of the two peaks (610 nm vs. 663 nm) in the visible band is similar to that observed at higher concentrations. (D) Peak normalized fluorescence excitation (solid lines) and emission (dotted lines) for MB (blue) and MB-strep (red) in PBS buffer. Fluorescence emission was collected with excitation at 655 nm for MB and 610 nm for MB-strep. Fluorescence excitation was collected with emission at 710 nm for MB and 690 nm for MB-strep. (E) Cross correlation curves for MB (blue circles) and MB-strep (red circles), fit by a single diffusing species (dotted lines). Excitation at 635 nm, detection through a 650–700 nm emission filter. All experiments were performed in PBS buffer, pH = 7.4.

