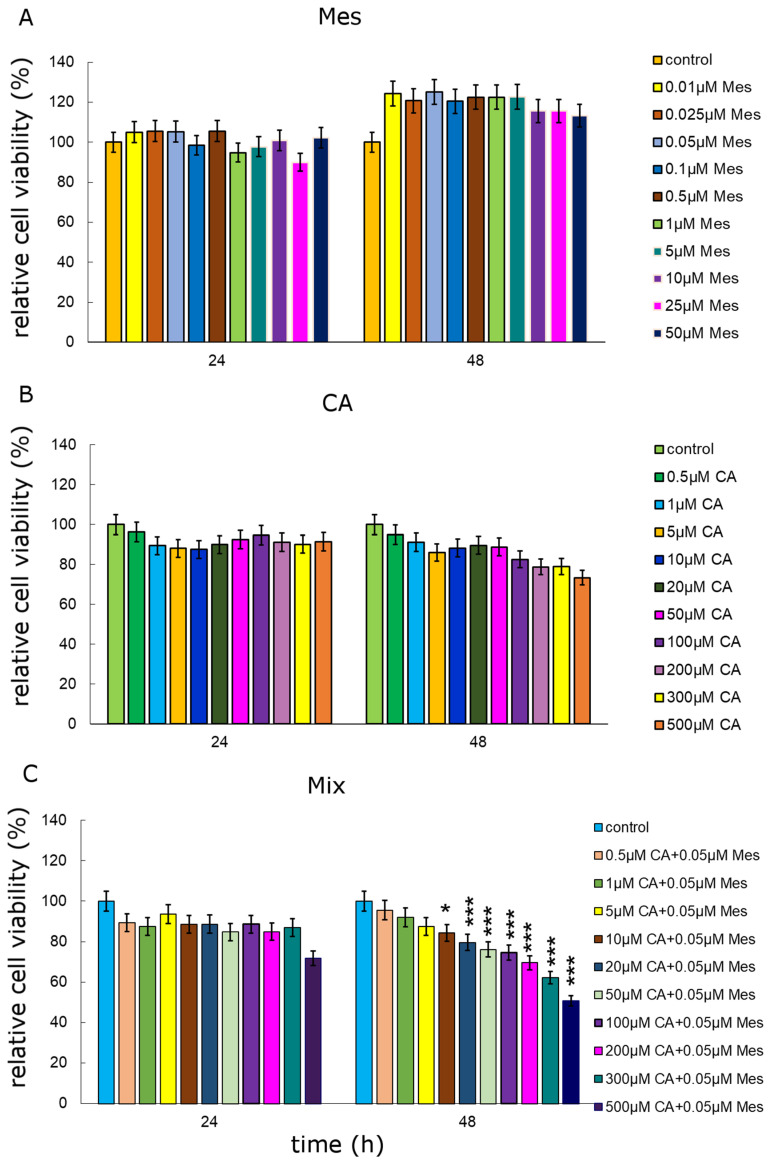
Figure 1.
Cell viability results for Caco-2 cell line exposed to different concentrations of CA (cichoric acid) (A), Mes (mesotrione) (B) and a mix of the two compounds (C) for 24 h and 48 h calculated as a percentage of control untreated cells. Each value on the graph is the mean of three independent experiments, and error bars show the standard deviation (SD). * p < 0.05, and *** p < 0.001 represent significant effects between the treatments and control followed by a Dunnett’s test.

