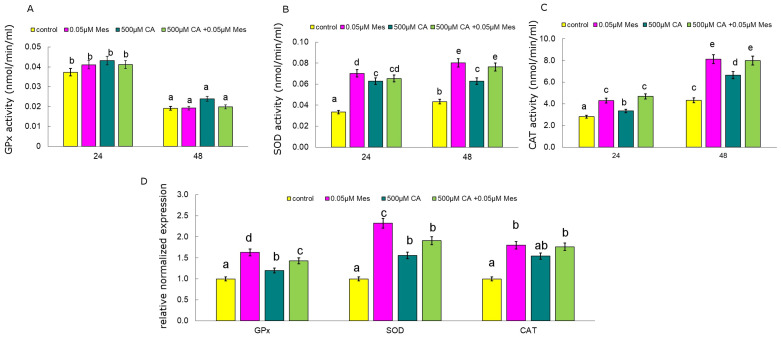
Figure 2.
The influence of CA, Mes and the mix of CA and Mes on catalase activity (A) GPx (glutathione peroxidase) activity (B) and SOD (superoxide dismutase) activity (C) and on GPx (glutathione peroxidase), SOD (superoxide dismutase) and CAT (catalase) relative gene expression (D) in Caco-2 cells. The cells were cultured with 500 µM of CA, 0.05 µM of Mes, and a mix of 500 µM CA + 0.05 µM Mes for 24 h and 48 h. Mean values from three independent experiments ± SD are shown. Different letters indicate statistical differences (p ≤ 0.05) between each treatment estimated by Tukey’s test.

