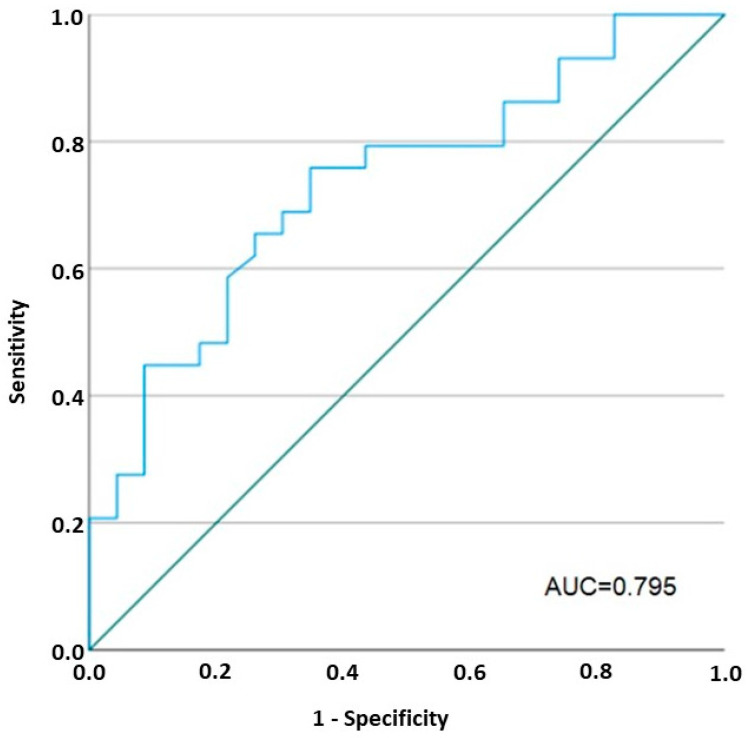
Figure 7.
Receiver operating characteristic (ROC) curve of TEER values in patients and controls. AUC: area under the curve. The ROC curve was generated by calculating the sensitivity and 1-specificity at all possible cut-offs. A univariate regression model was created to evaluate the association between the obtained cut-off for the TEER value and clinical outcomes in all IBD patients; n = 26 healthy controls, n = 22 IBD patients at baseline, n = 18 IBD patients after 24 weeks of VDZ treatment, n = 12 IBD patients after 52 weeks of VDZ treatment. The green line is the reference line.

