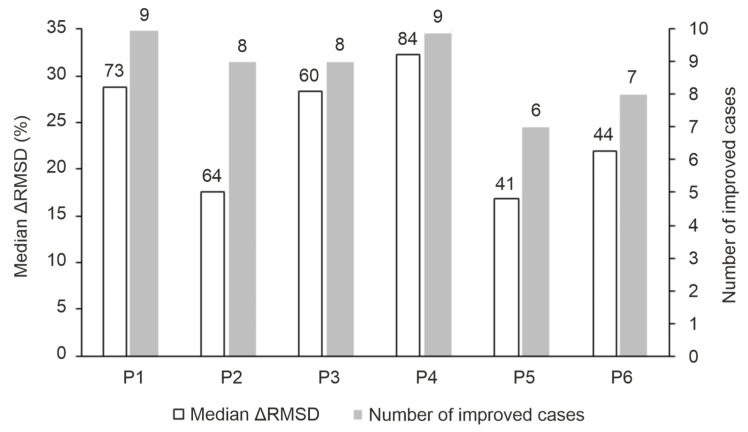
Figure 4.
General performance of the MD refinement protocols. Empty bars indicate the median ΔRMSD (%) obtained by each protocol for the set of systems in Table 1 and the number on top shows the largest ΔRMSD (%) of the protocol. ΔRMSD (%) was calculated according to Equation (3) (Section 3). The full bars indicate the number of systems that have any improvement (ΔRMSD ≥ 0.1 Å) in a protocol and the number on top shows the number of systems with large improvements (ΔRMSD ≥ 1 Å).

