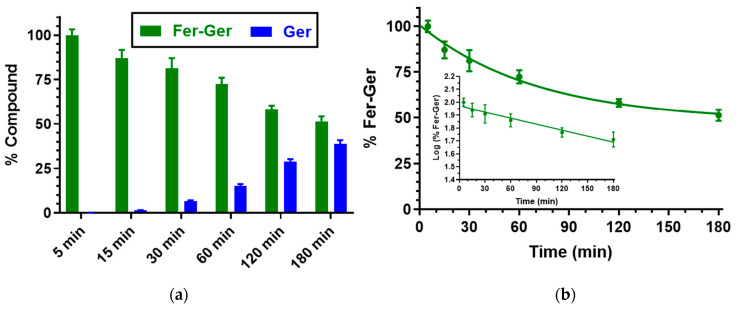
Figure 3.
(a) Degradation profile of the prodrug Fer-Ger (green) and the corresponding appearance profile of its hydrolysis product Ger (blue) in human whole blood. All the values are reported as the percentage of the overall amount of incubated Fer-Ger. (b) Degradation profile of the prodrug Fer-Ger in human whole blood. The degradation of the prodrug follows pseudo-first-order kinetics, confirmed by the linearity of the semi-logarithmic plot reported in the inset (n = 6, r = 0.977, p < 0.001), whose half-life value is 193.64 ± 20.93 min. All data are reported as the mean ± S.E.M. of three independent experiments.

