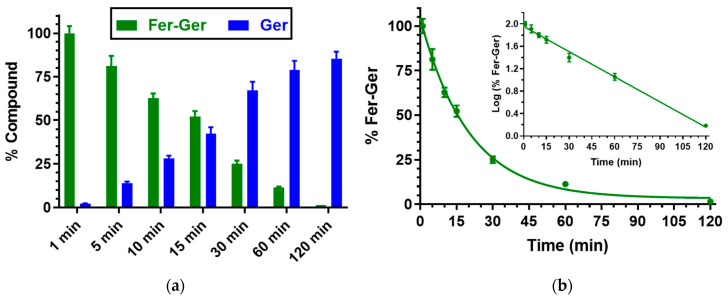
Figure 4.
(a) Degradation profile of the prodrug Fer-Ger (green) and the corresponding appearance profile of Ger (blue) in rat whole blood. All the values are reported as the percentage of the overall amount of incubated Fer-Ger. (b) Degradation profile of the prodrug Fer-Ger in rat whole blood. The degradation of the prodrug follows a pseudo-first-order kinetic, confirmed by the linearity of the semi-logarithmic plot reported in the inset (n = 6, r = 0.997, p < 0.0001), whose half-life value is 20.15 ± 0.75 min. All data are reported as the mean ± S.E.M. of three independent experiments.

